
I used to put a Search Console slide in client decks that said, “I don’t care about our branded search.” I admitted on an episode with Drew Dorenfest that it can’t survive as an SEO practice. The trouble was that you couldn’t actually measure brand, because Search Console hides most of your queries.
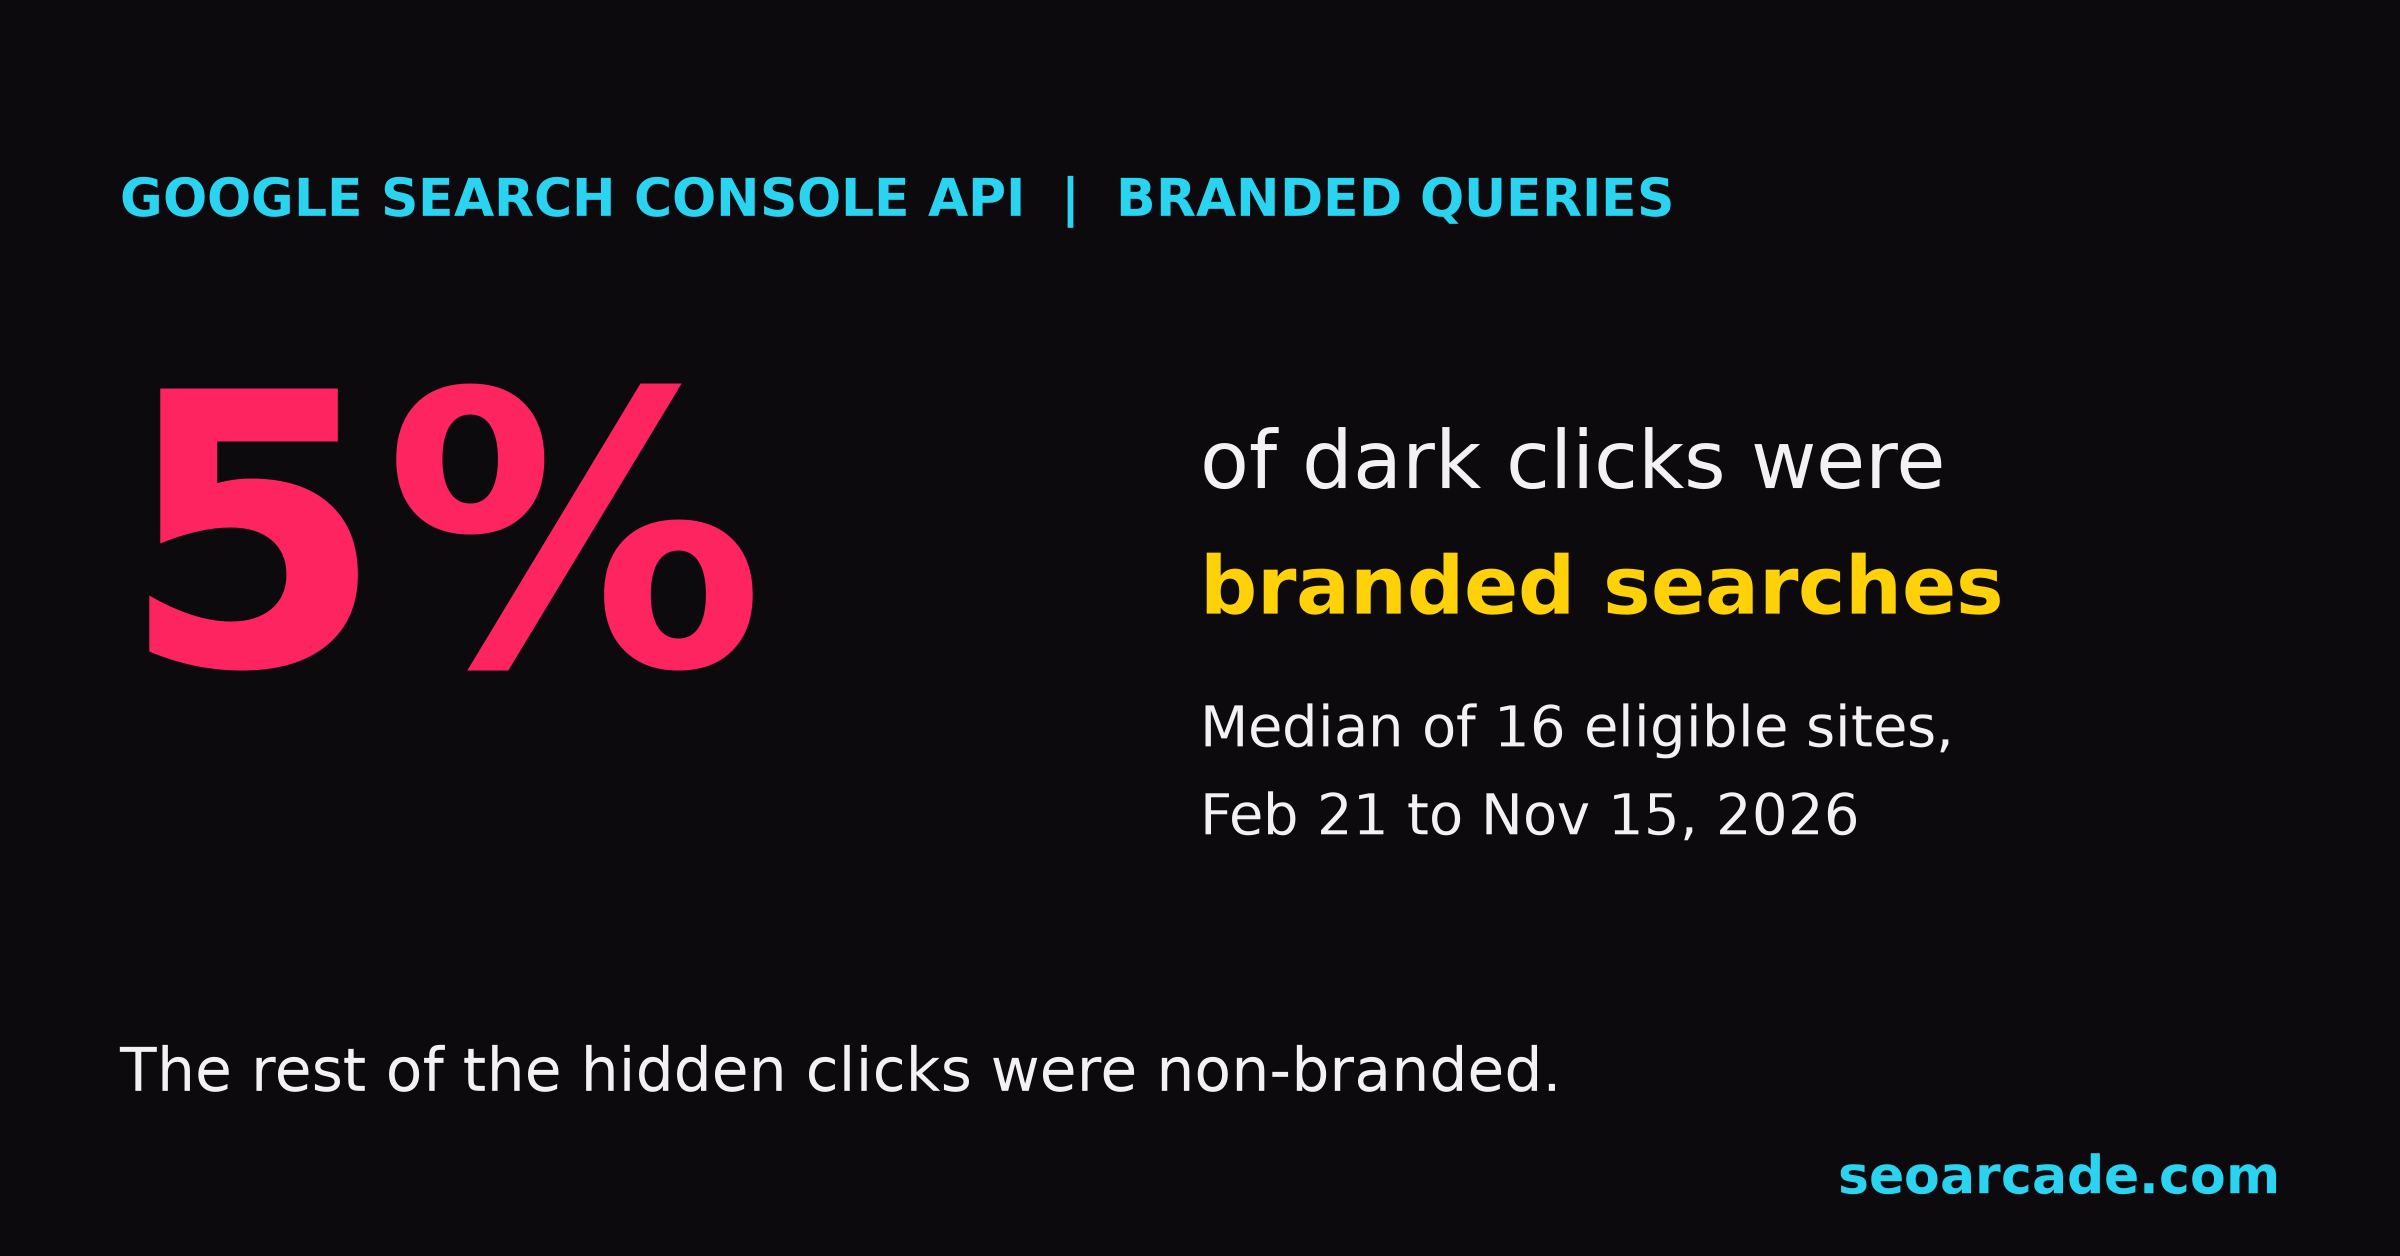
That changed on November 16, 2026. Google added a brandedClassification dimension to the Search Console API. Every click and impression now comes back labeled BRANDED or NON_BRANDED, and the two labels add up to your property total, anonymized queries included. So for the first time you can ask what share of your dark clicks were people searching for you. I pulled it across 94 properties on one account. The short answer: on the median site, only 5% of the dark clicks were branded. The rest were non-branded searches Google still won’t name.
What Google changed in the Search Console API
The Search Central announcement is short, and it’s typically Google-vague about the details. The Search Analytics API reference fills in more, and I tested the rest against a live account. Here’s what you get:
- A new dimension and filter. Group by
brandedClassificationor filter on it. The only values areBRANDEDandNON_BRANDED. - Only
equalsworks. AnotEqualsfilter returns a 400: “Operator NOT_EQUALS is not supported for BRANDED_CLASSIFICATION.” - No query filter in the same request. Pair the brand filter with a
queryfilter and you get “Branded classification cannot be combined with a query filter.” You can group by query and brand together, which is what makes the rest of this post possible. - It combines with
date,page,device,countryandqueryas dimensions. It does not combine withsearchAppearance, and Discover requests refuse it outright. - Data starts February 21, 2026. Ask for 16 months and you only get labels from that date forward.
- Only “eligible” properties get rows. Everything else gets an empty response with no error, which is a trap I’ll come back to.
The labels themselves aren’t new. They come from the branded queries filter Google added to the Performance report in November 2025, which it describes as “an internal, AI-assisted system.” It counts your brand name in all languages, misspellings, and queries about a product or service unique to your site even when the brand name never appears. What’s new is that you can pull it by script, at scale, and join it to everything else the API returns.
Google also shipped two smaller changes in the same post: a webMultimodal search type (Google Lens, Circle to Search and image uploads) and filterLists, which matches several countries or devices in one filter. Useful, but the brand split is the one that changes how you report.
The branded split adds up to the total. The query rows don’t.
If you’ve read my rant about missing Search Console clicks, you know the problem. Ask the API for your property total and you get one number. Ask for every query row, paginate to the very last one, add them up, and you get a much smaller number. The difference is the anonymized remainder. In my dark-click study of 38 sites, the median site had 72% of its clicks with no query attached.
The brand split doesn’t have that problem. On every eligible property I tested, BRANDED plus NON_BRANDED equaled the property total exactly, click for click. Here’s seoarcade.com from February 21 to November 15, 2026:
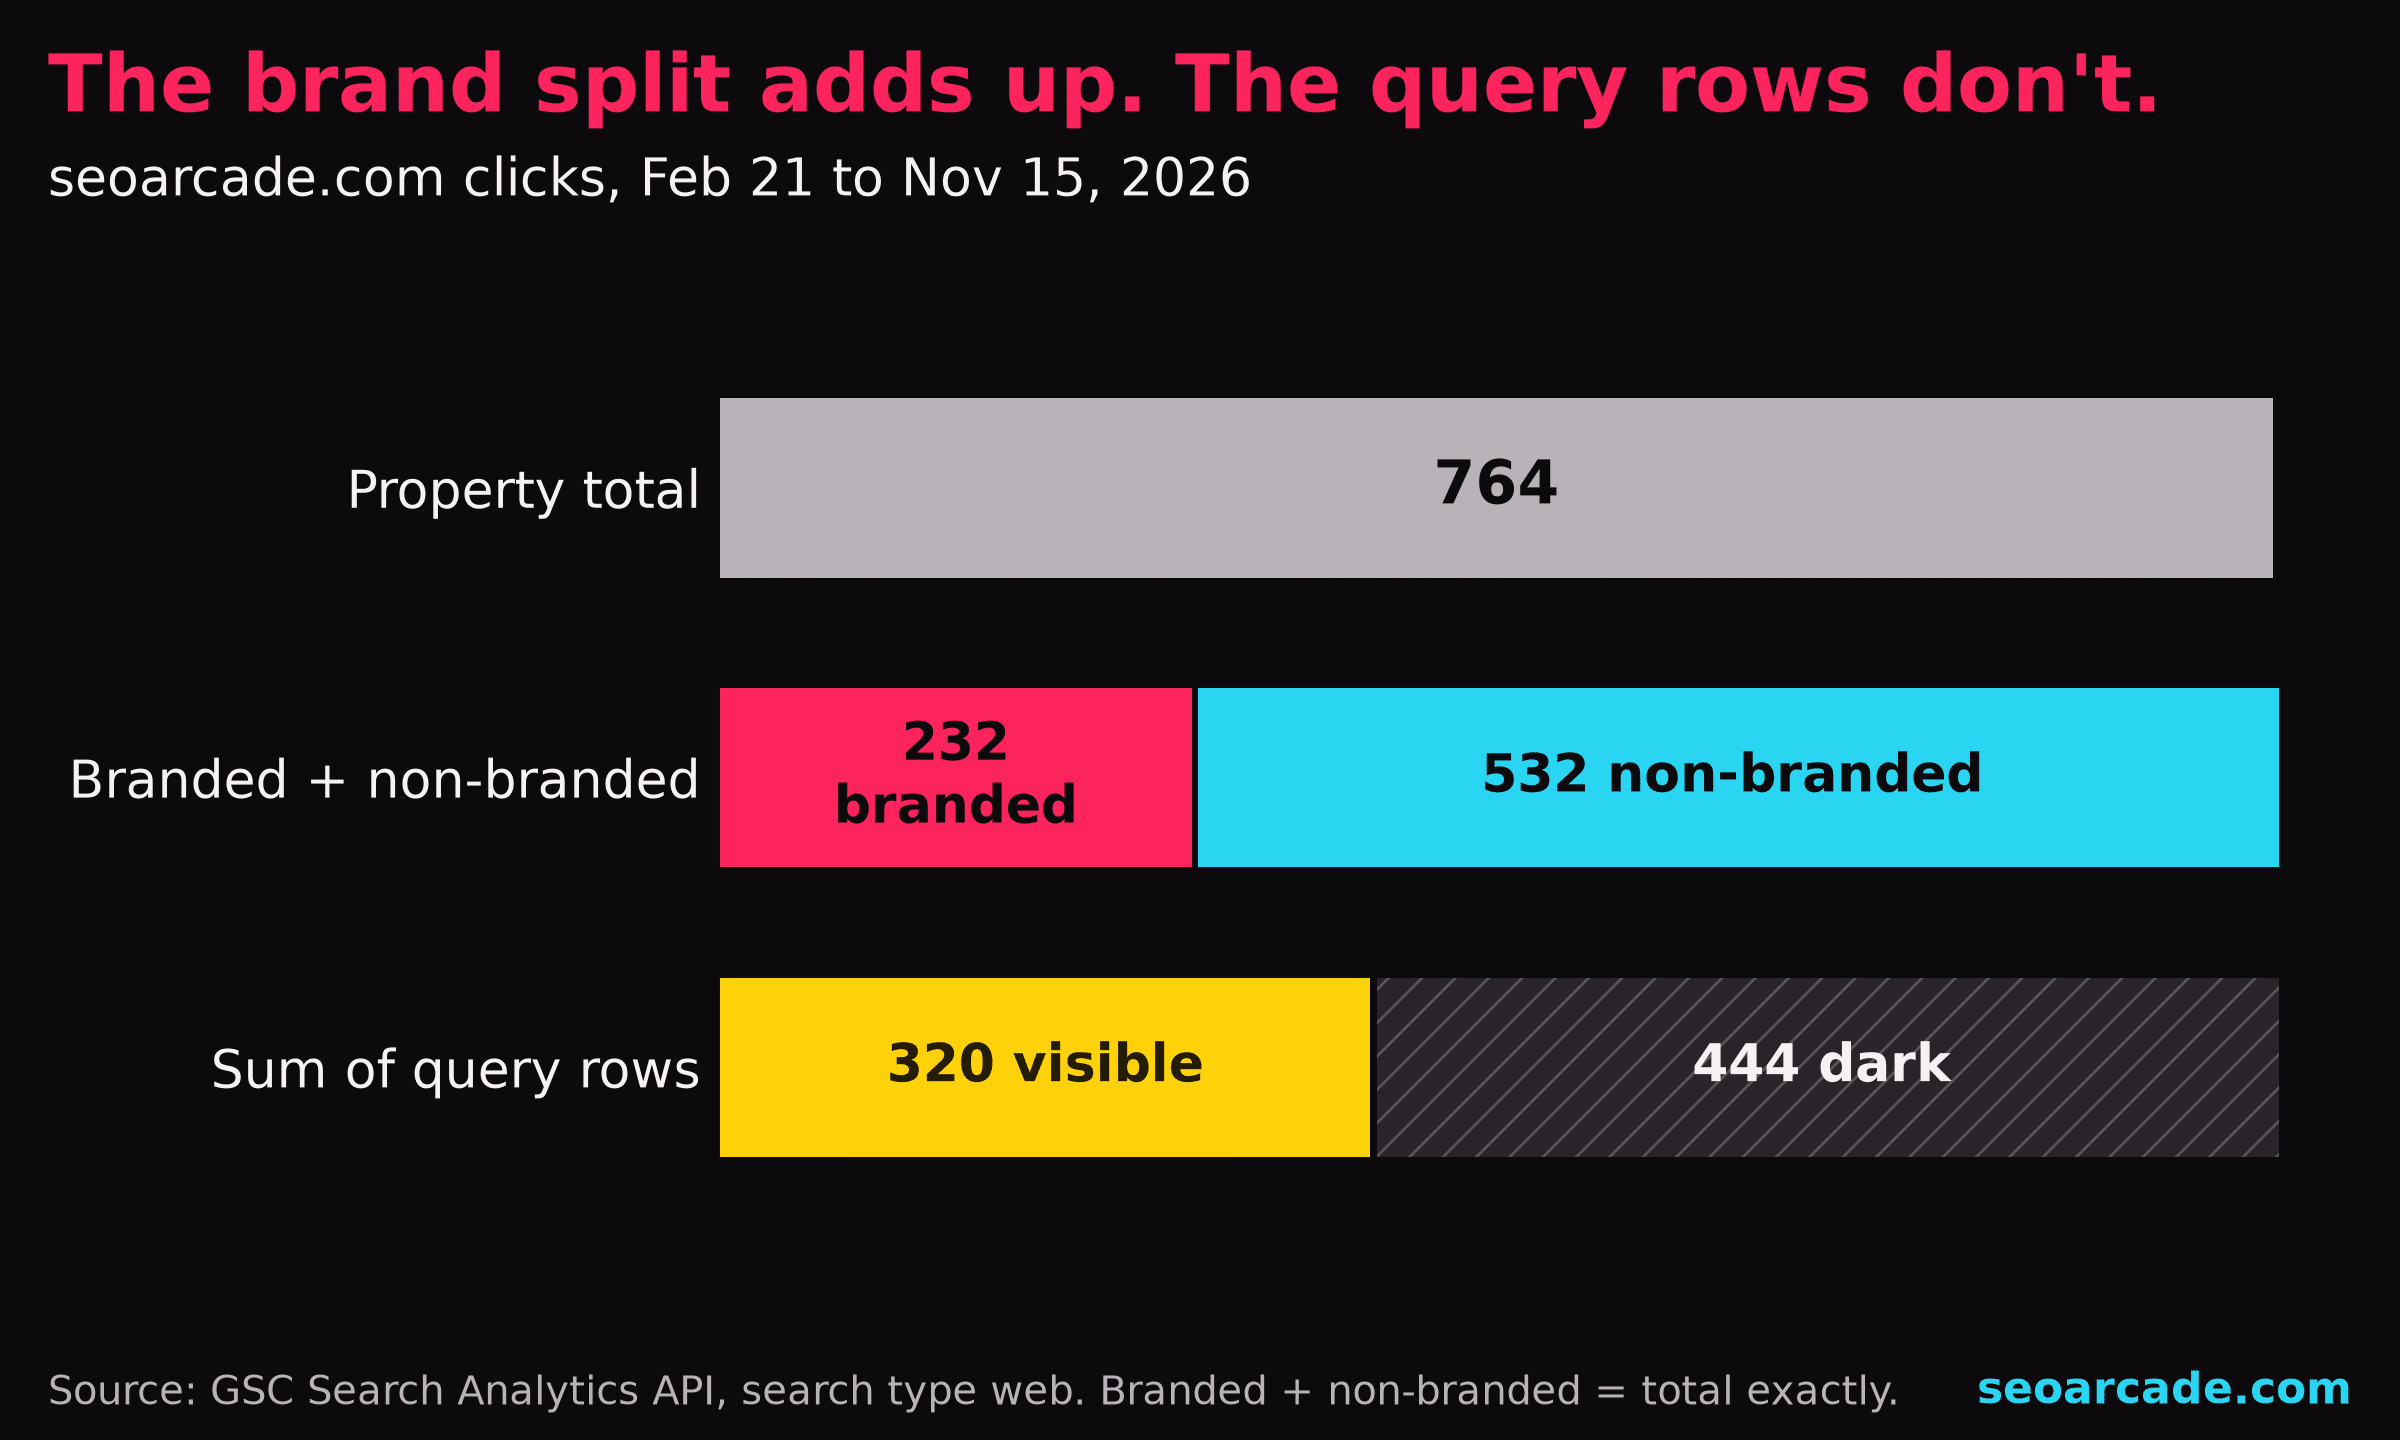
That’s 764 total clicks. Google labels 232 branded and 532 non-branded. The query rows only account for 320, which leaves 444 dark. So Google is willing to tell you whether a hidden click was a brand search. It still won’t tell you what the search was.
Now group by query and brand, filtered to each label, and you can split the dark clicks themselves. On seoarcade.com, 190 of the 232 branded clicks sit on visible query rows (every one of them on a single query, “seo arcade”). That leaves 42 branded clicks hidden. The non-branded side has 130 visible and 402 hidden. So 9% of the dark clicks were branded and 91% weren’t.
“Increased brand searches is definitely a powerful signal to Google.”
Jason Barnard, CEO of Kalicube, on Unscripted SEO (8:07)
If Jason’s right (and I think he is), brand demand deserves its own line in your reports. Until this week you were guessing at it from the queries Google chose to show you.
How much of your dark traffic is branded?
Not much. That’s the short answer, and it’s the question I asked under Matthew Mellinger’s LinkedIn post about the update. Matthew co-founded SEO Gets (he was on the show talking about Search Console data you can trust), which already shows the split in an anonymization tab, and he answered that for them, non-branded terms were “like 80%-85% of anonymization.” So I ran it on every property I could reach.
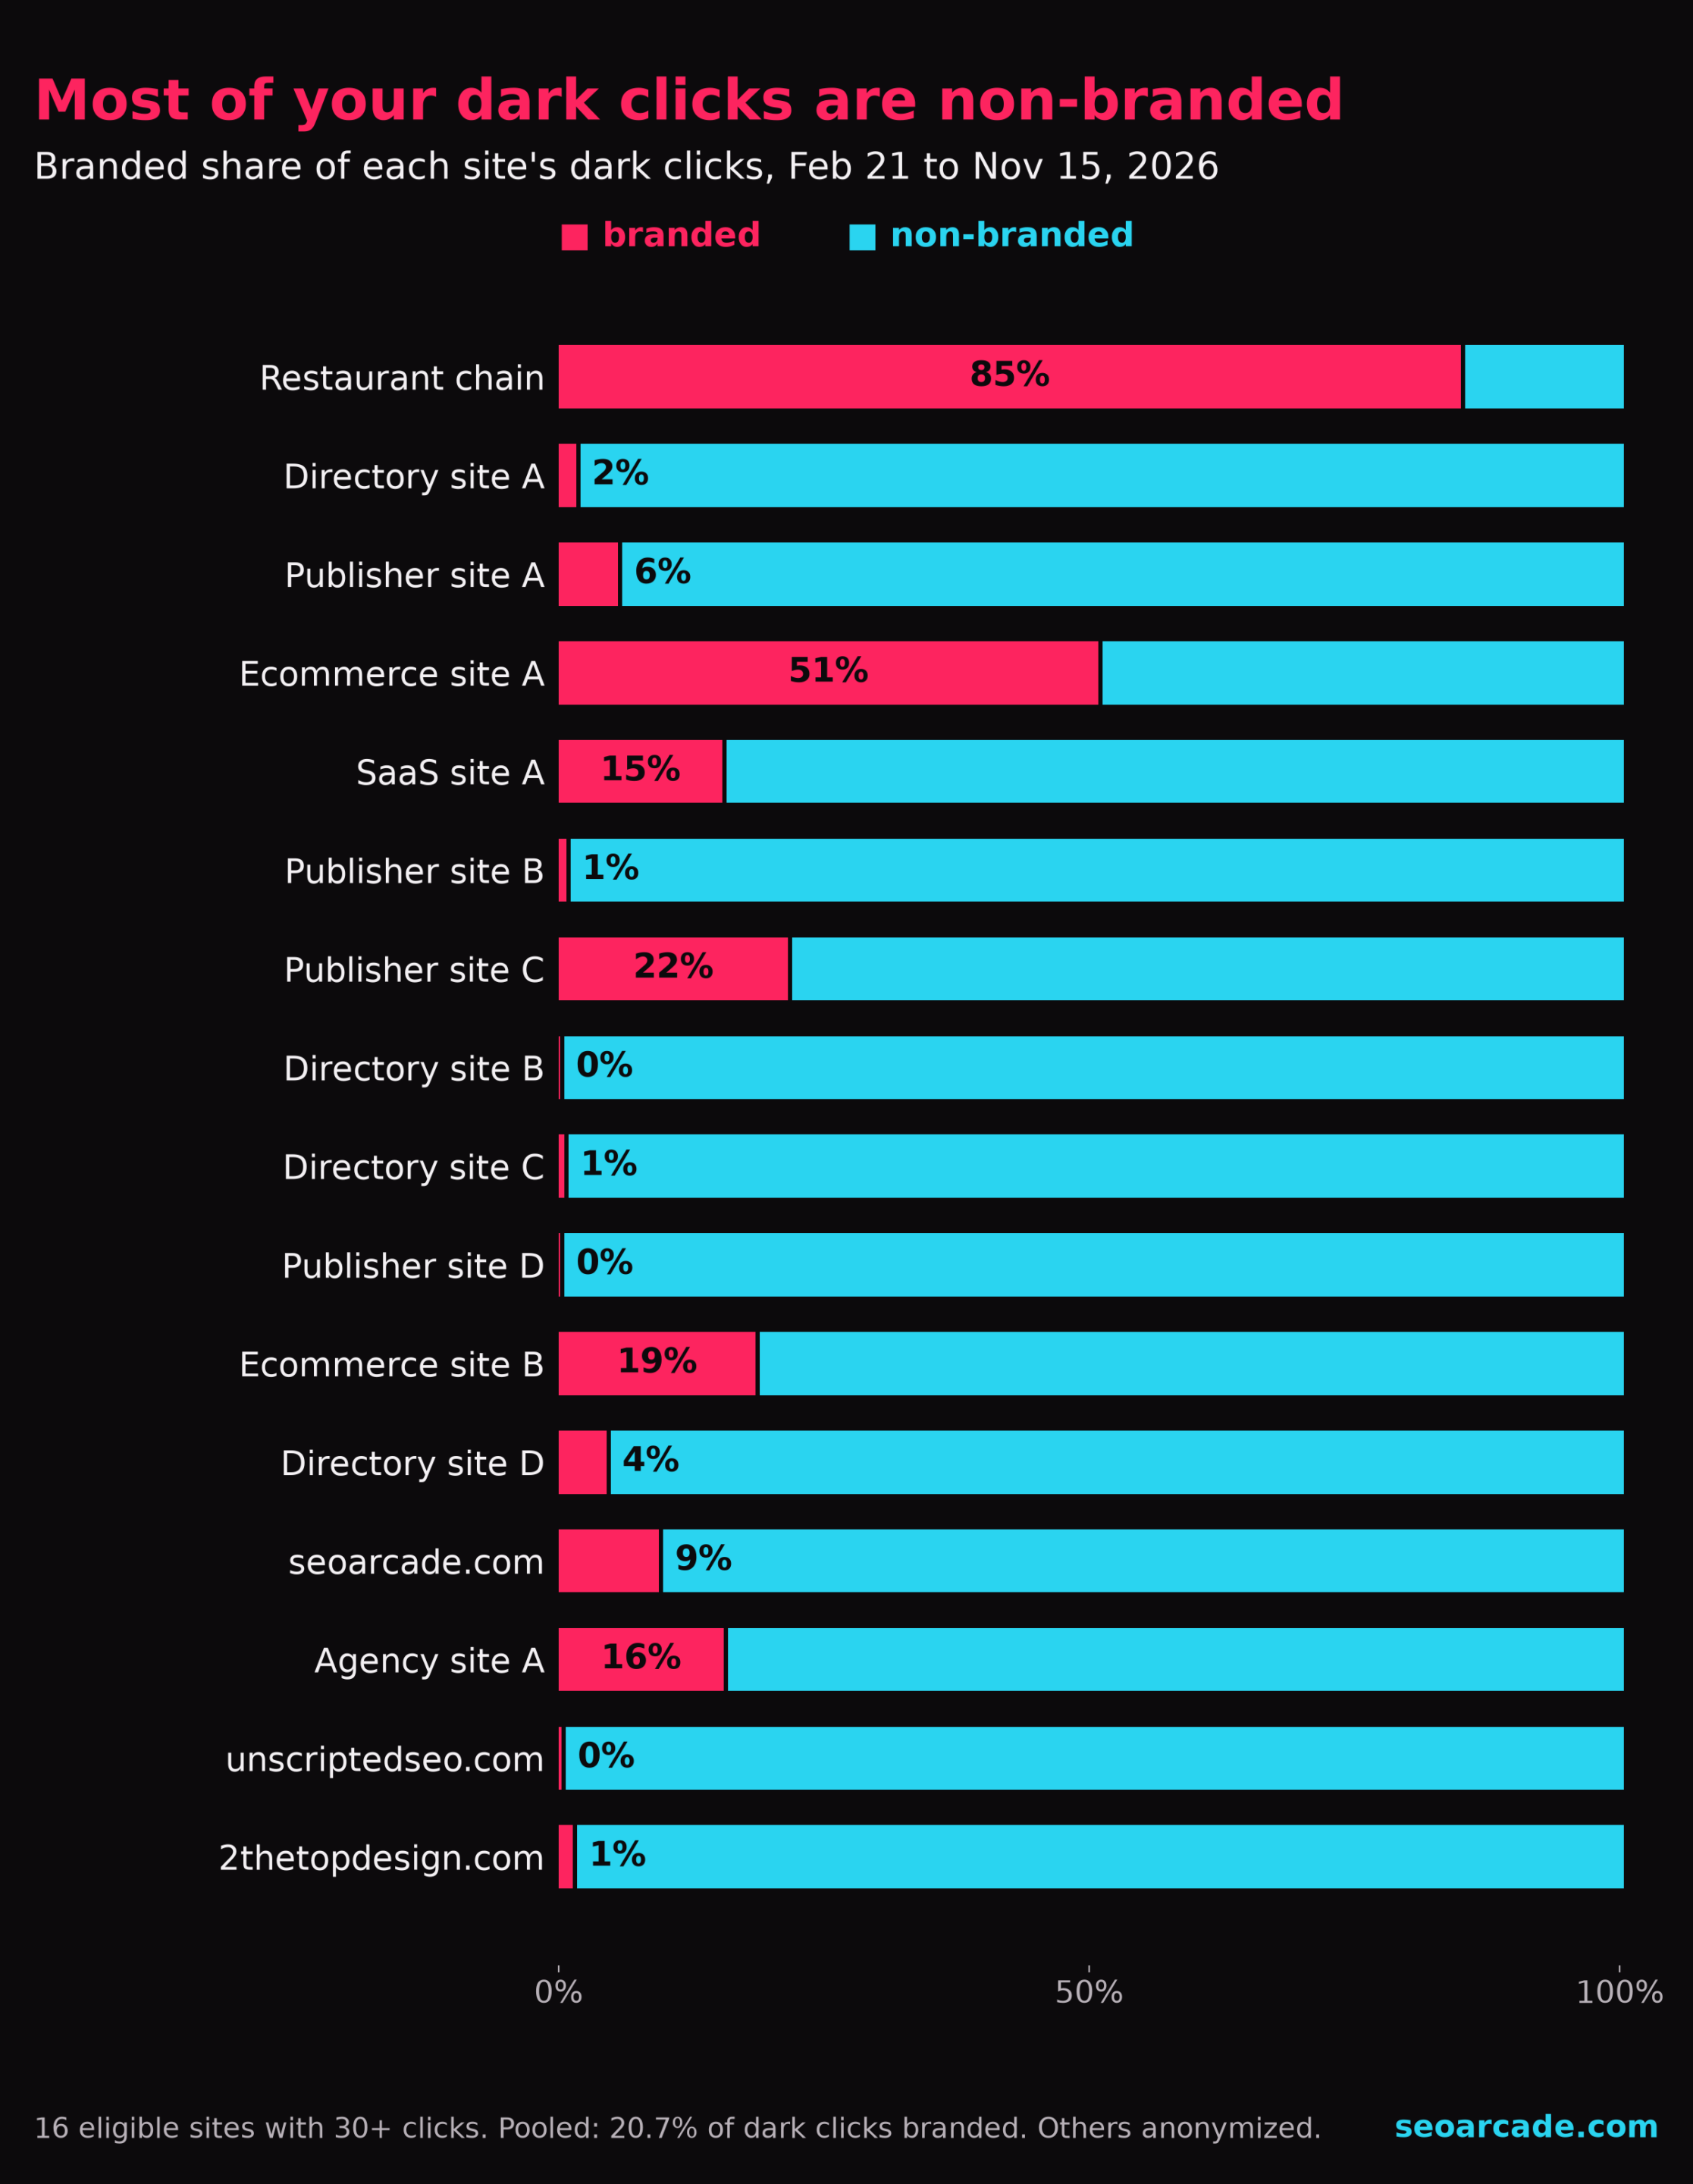
Across 16 eligible sites with at least 30 clicks, the median share of dark clicks labeled branded was 5%. Pooled across every click, it was 20.7%, and two sites drag that number up: a restaurant chain where 85% of the dark clicks were branded, and an ecommerce brand at 51%. When the brand is the business, people search the name, and the hidden clicks follow. For everybody else, Matthew’s 80% to 85% non-branded is close to what I saw, and on most sites it ran higher. Most hidden clicks are people who didn’t search for you by name.
Turn it around and look at each bucket on its own, and the pattern is sharper. Google hides non-branded clicks far more often than branded ones:
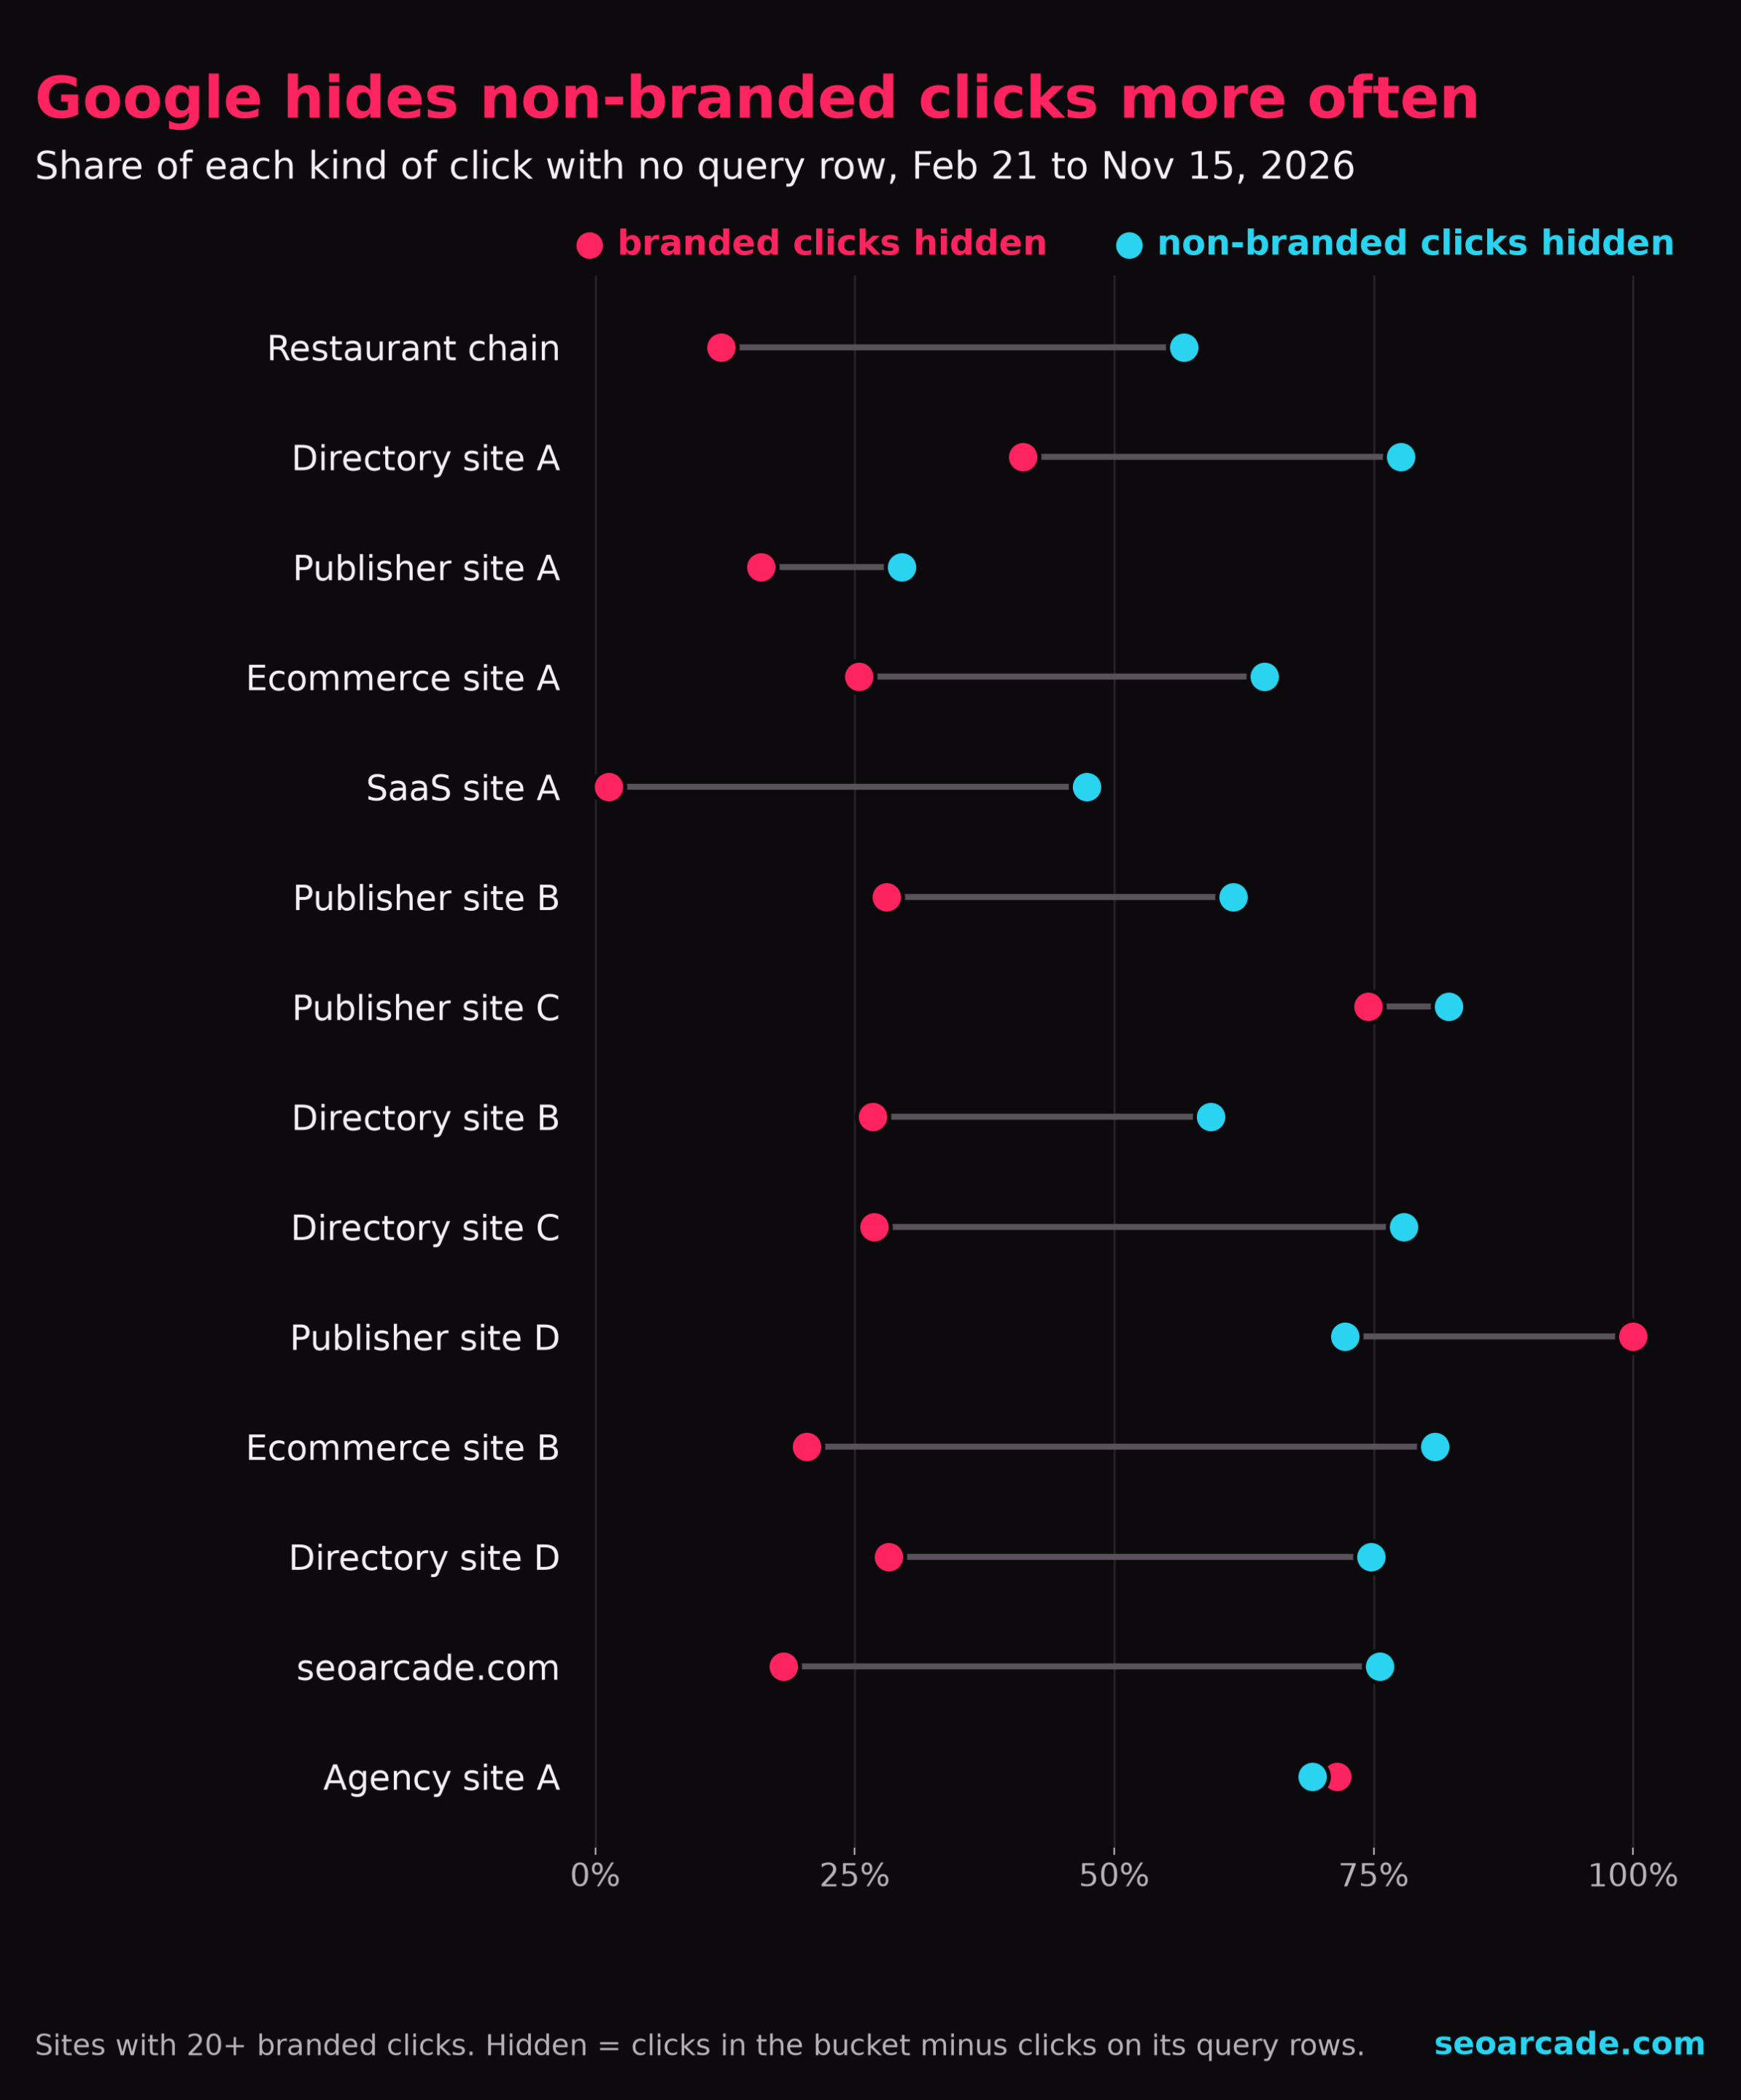
On the median site, 27% of branded clicks had no query row, against 71% of non-branded clicks. That makes sense once you think about how anonymization works. Brand searches are repetitive: lots of people type the same few words. Non-branded searches are a long tail of one-off phrasings, and one-off phrasings are exactly what Google drops for privacy.
Here’s the part that should change how you report. If you’ve been estimating brand share with a regex on your visible queries (I wrote a whole Search Console regex library for that), you’ve been overstating how branded your traffic is. The visible rows are skewed toward brand because brand is what survives anonymization.
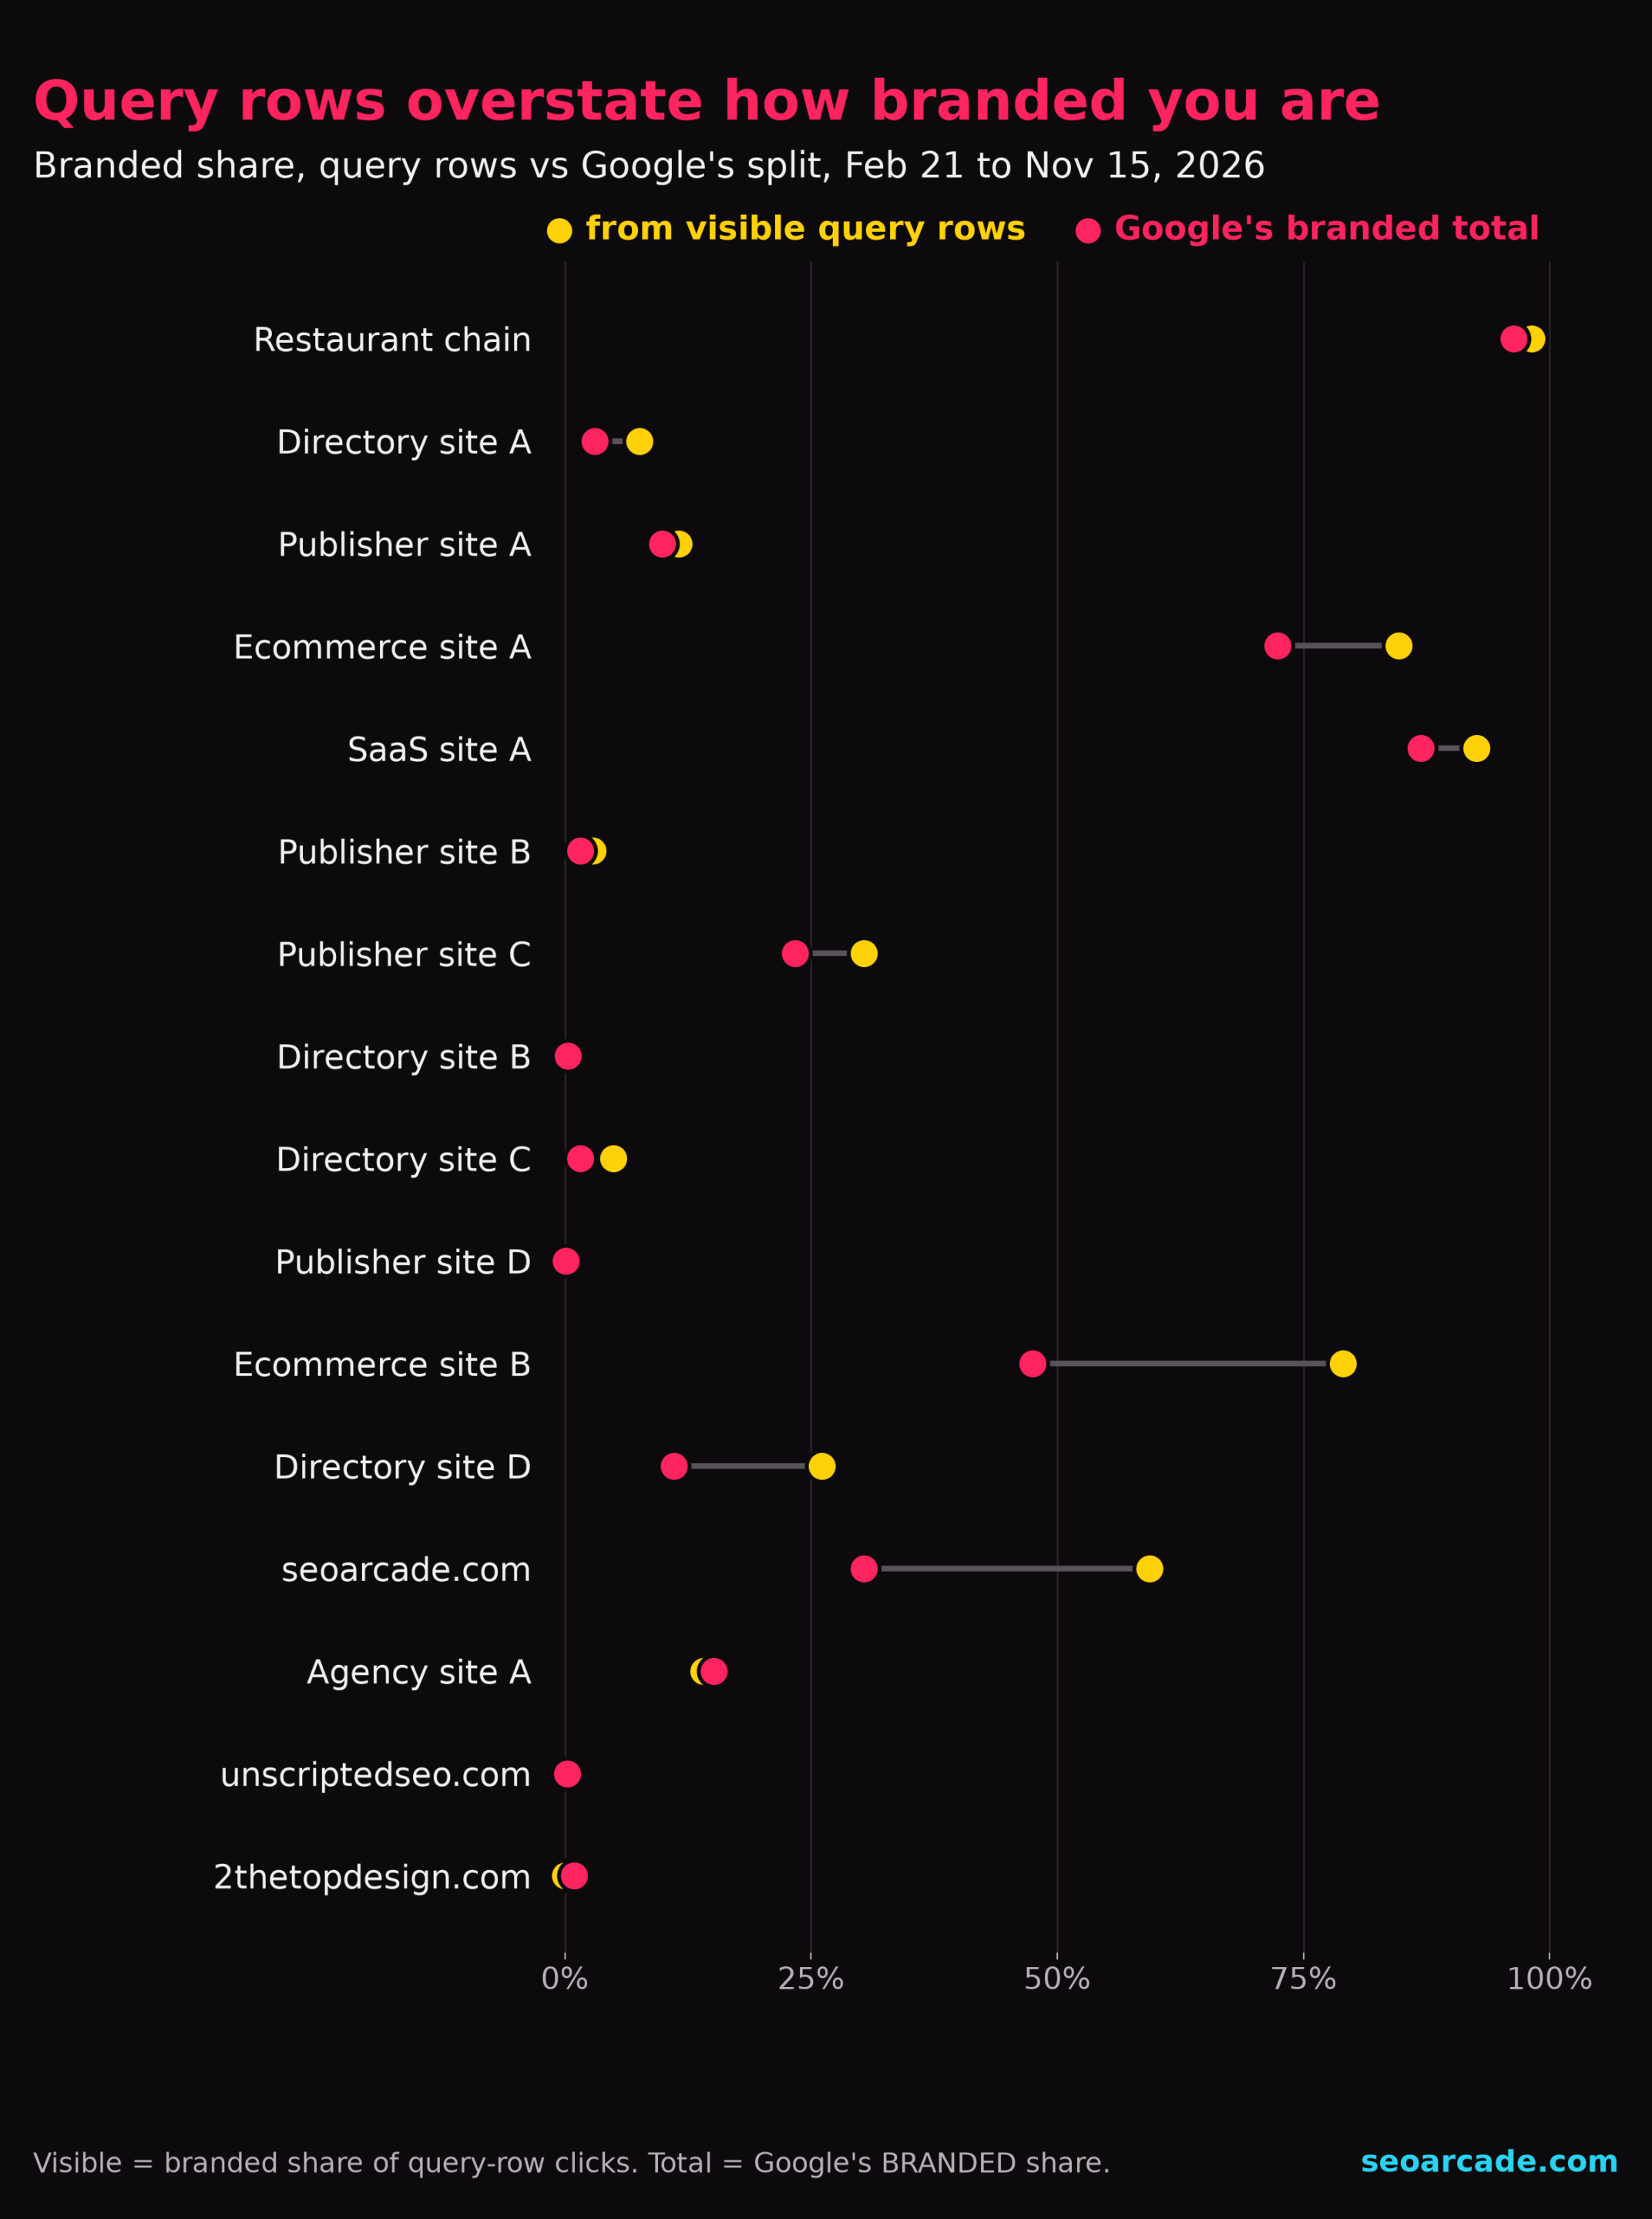
On seoarcade.com the visible query rows say 59% of clicks are branded. Google’s complete split says 30%. That’s the difference between “most of our search traffic already knows us” and “most of it doesn’t,” and you’d make very different decisions from each.
“less people are doing that branded search than you maybe think.”
Drew Dorenfest, Client Magnet CRM, on Unscripted SEO
What the branded filter still won’t tell you
It won’t tell you a single hidden query. The dark clicks are exactly as dark as they were last week — you just know which side of the brand line they fell on. Matthew made the same point about editing: the label is Google’s, and you can’t correct it.
Here are the limits I hit in the data:
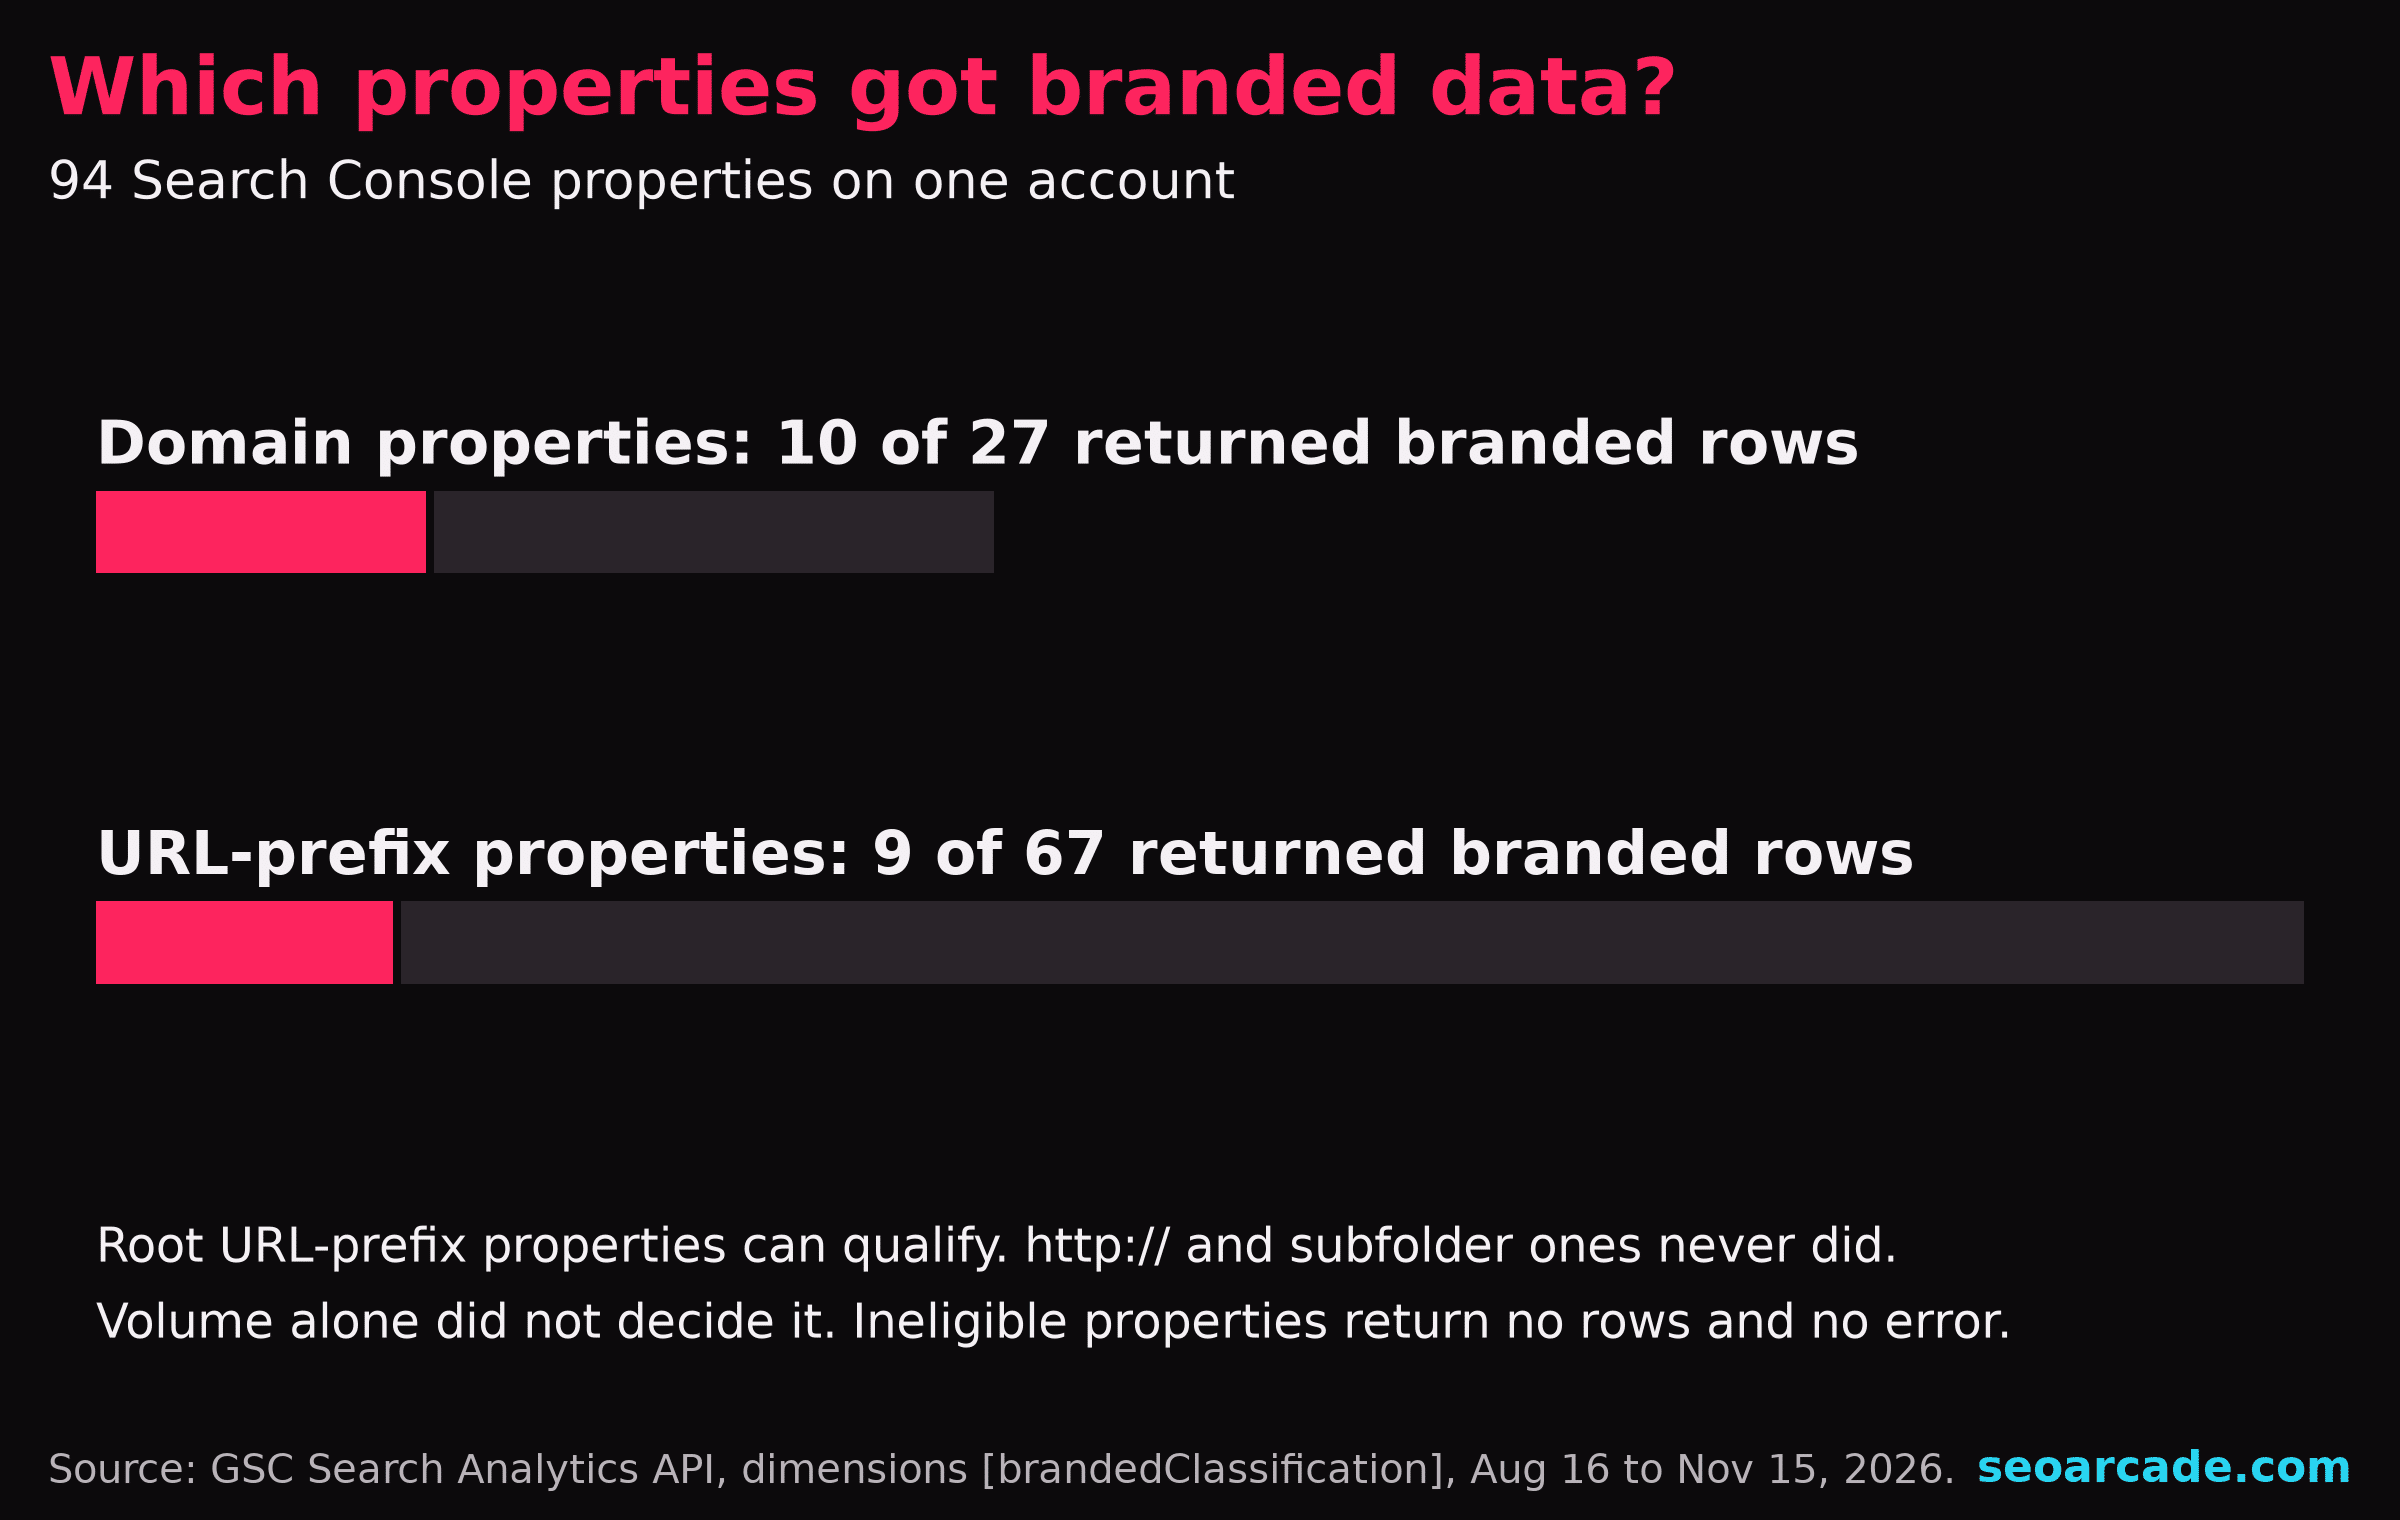
- Most properties get nothing. 10 of 27 domain properties and 9 of 67 URL-prefix properties on this account returned branded rows. Root URL-prefix properties can qualify (one with 62 clicks in three months did), while a domain property with hundreds of clicks didn’t. Volume alone didn’t decide it.
- An empty answer looks like a real zero. An ineligible property returns no rows and no error. jeremyriveraseo.com returns nothing, and that’s eligibility, not a site with zero brand searches. Always run a plain total request alongside it before you believe a zero.
- The history is short. On a 16-month request, seoarcade.com shows 1,509 clicks in total but only 764 carry a label, because nothing before February 21, 2026 is classified.
- The classifier makes calls you’d make differently. On unscriptedseo.com, Google labels “unscripted small business podcast” non-branded. That’s a sister show on the same network, so I’d count it as brand. Google doesn’t, and there’s no override.
- No Discover, no search appearance. Image search works. Discover and
searchAppearancerequests refuse the dimension.
And remember that Search Console itself undercounts clicks by roughly 10% against Clarity. The brand split is a cleaner cut of Google’s number. It doesn’t make Google’s number the truth (it never was).
Brand demand over time is the report you can finally build
The monthly view is where this gets useful for strategy. Here’s seoarcade.com by Google’s label:
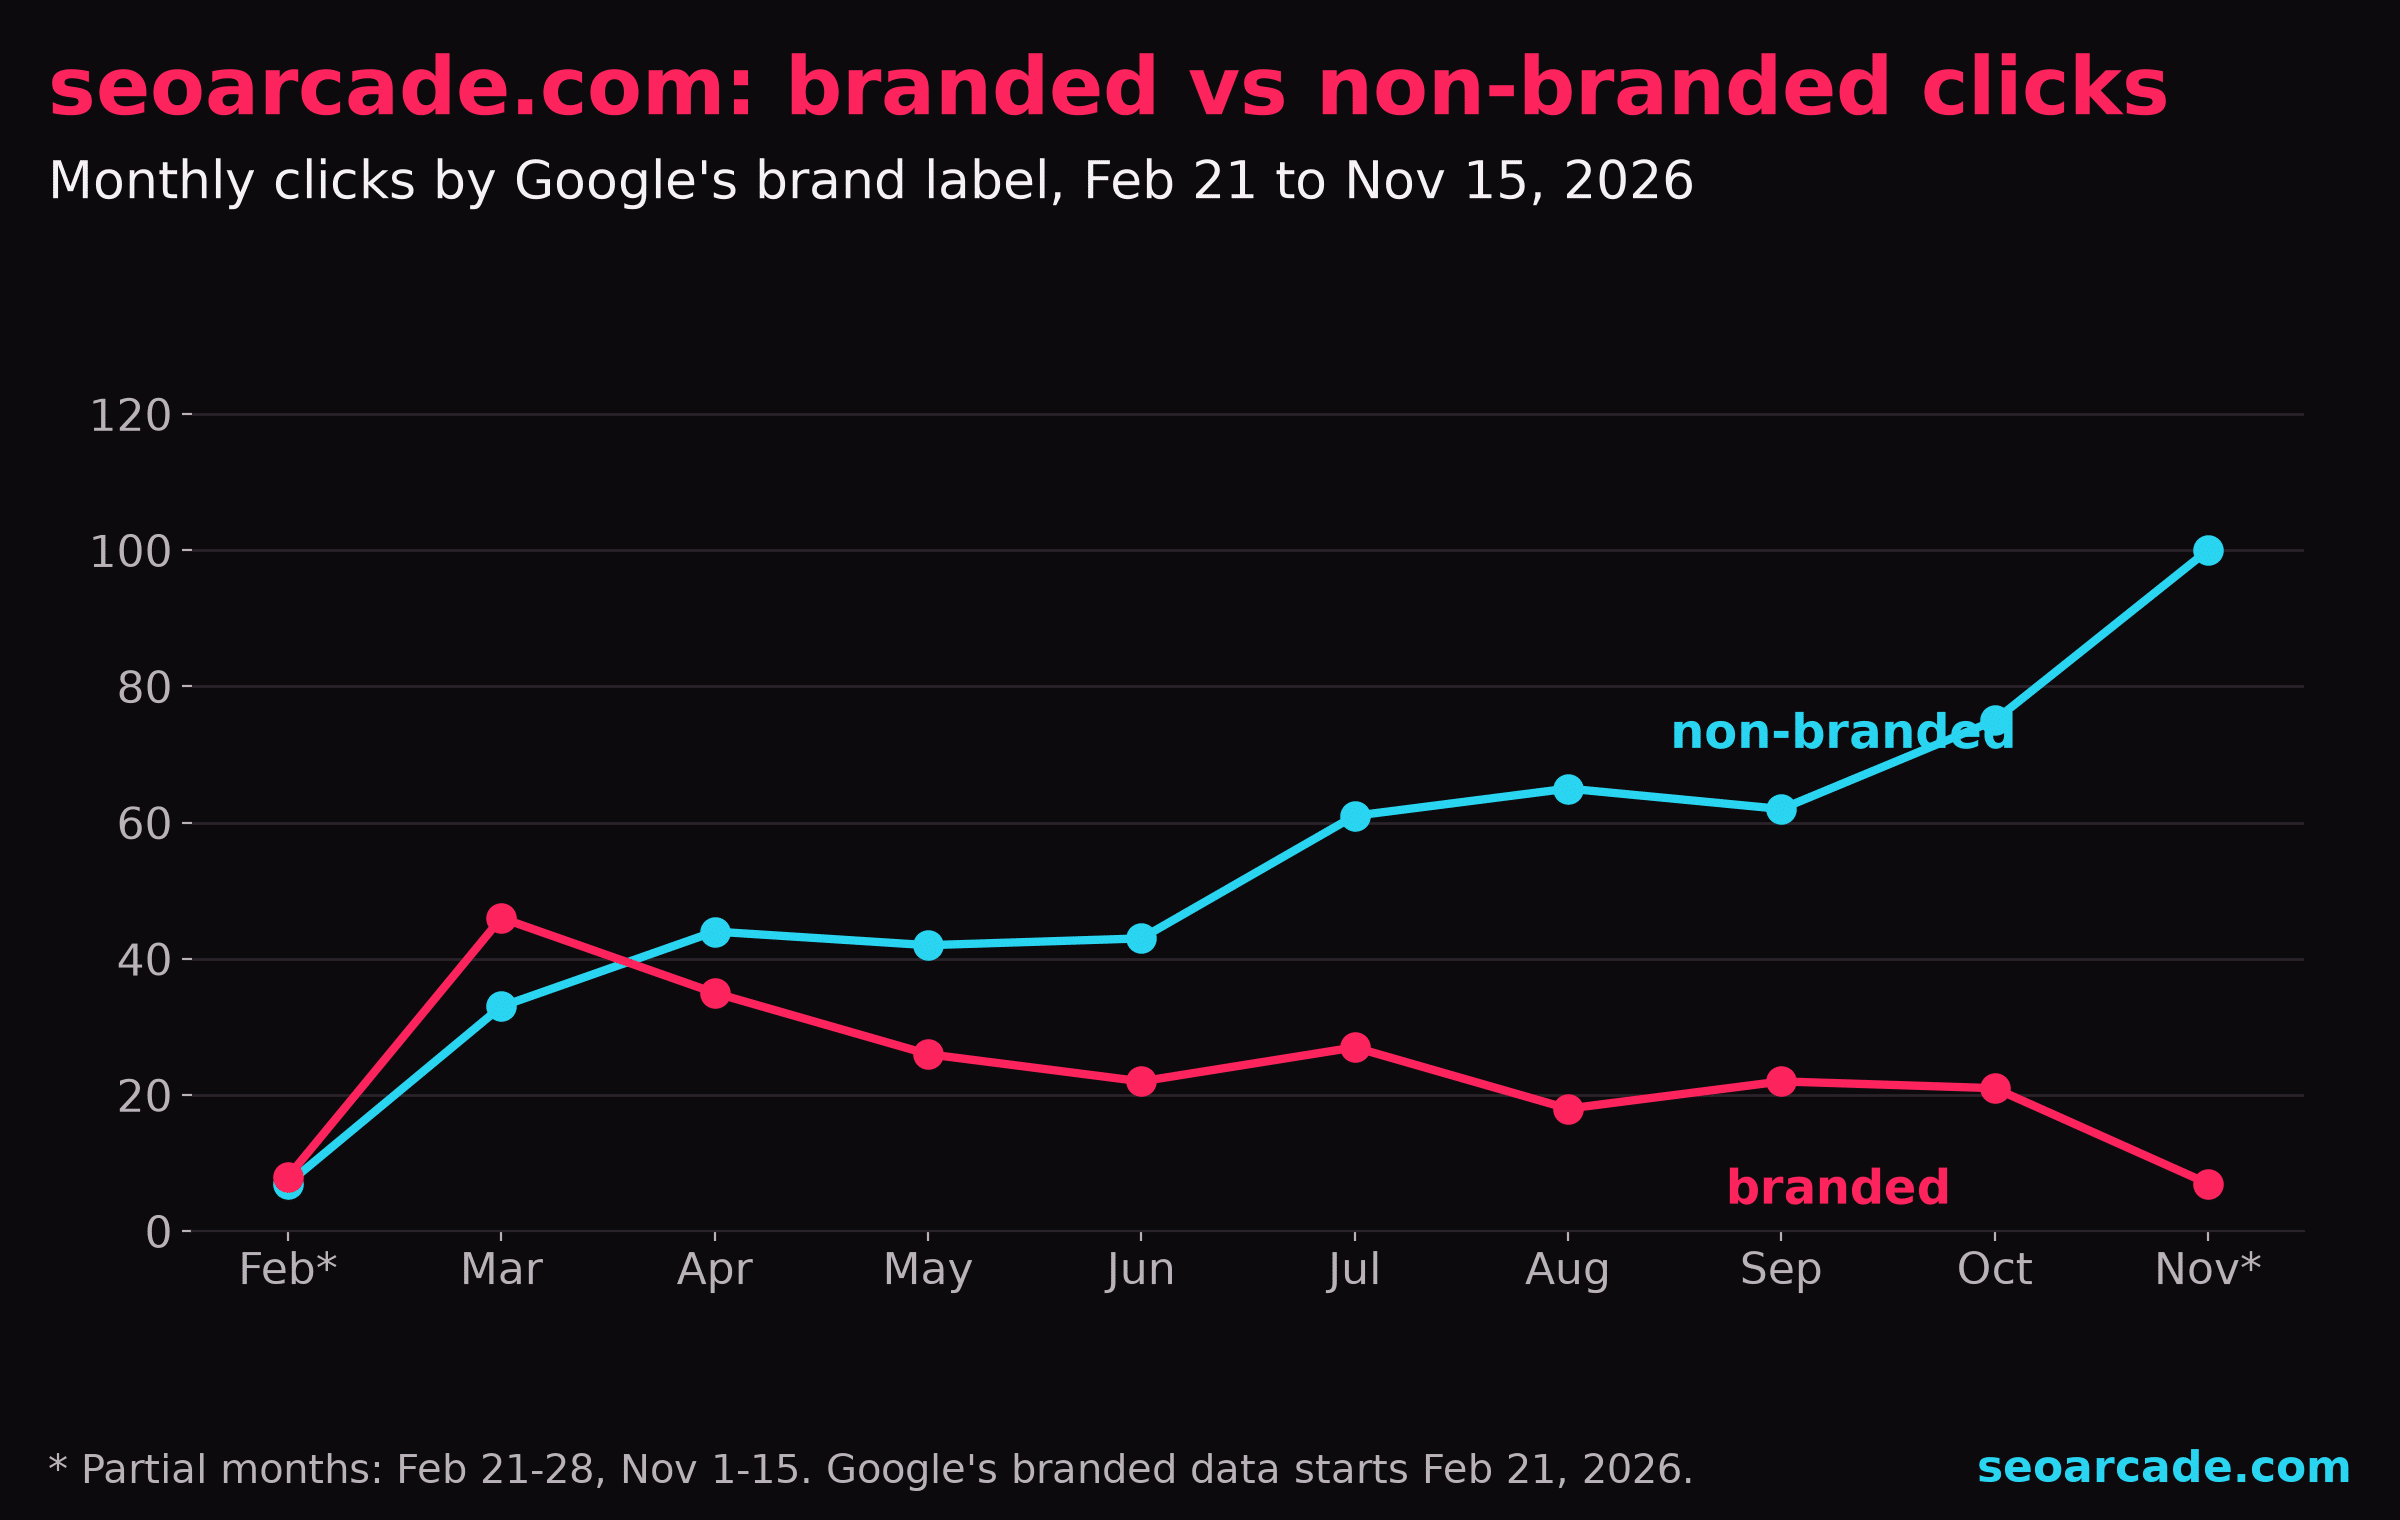
Branded clicks peaked in March and drifted down to the low 20s a month, while non-branded clicks more than doubled between March and October. If you’d run this site’s reporting from visible queries alone, the brand line would look far more important than it is. What the chart actually says is that content is doing the work, and the brand isn’t growing on its own.
“What is the brand search volume for each of these companies? That would kind of give you an idea of where they are in the market for the position.”
Patrick Stox, independent SEO consultant (formerly Ahrefs), on Unscripted SEO (one repeated “the” trimmed)
Patrick was talking about competitors, but the same logic applies to your own site. Brand search is a read on where you sit in the market. With the split by month, you can line it up against the things that are supposed to build a brand (podcast appearances, PR, a personal brand push, entity work) and see if the line moves. That’s the multi-channel attribution question with one more piece of evidence on the table.
How to pull branded and non-branded clicks from the API
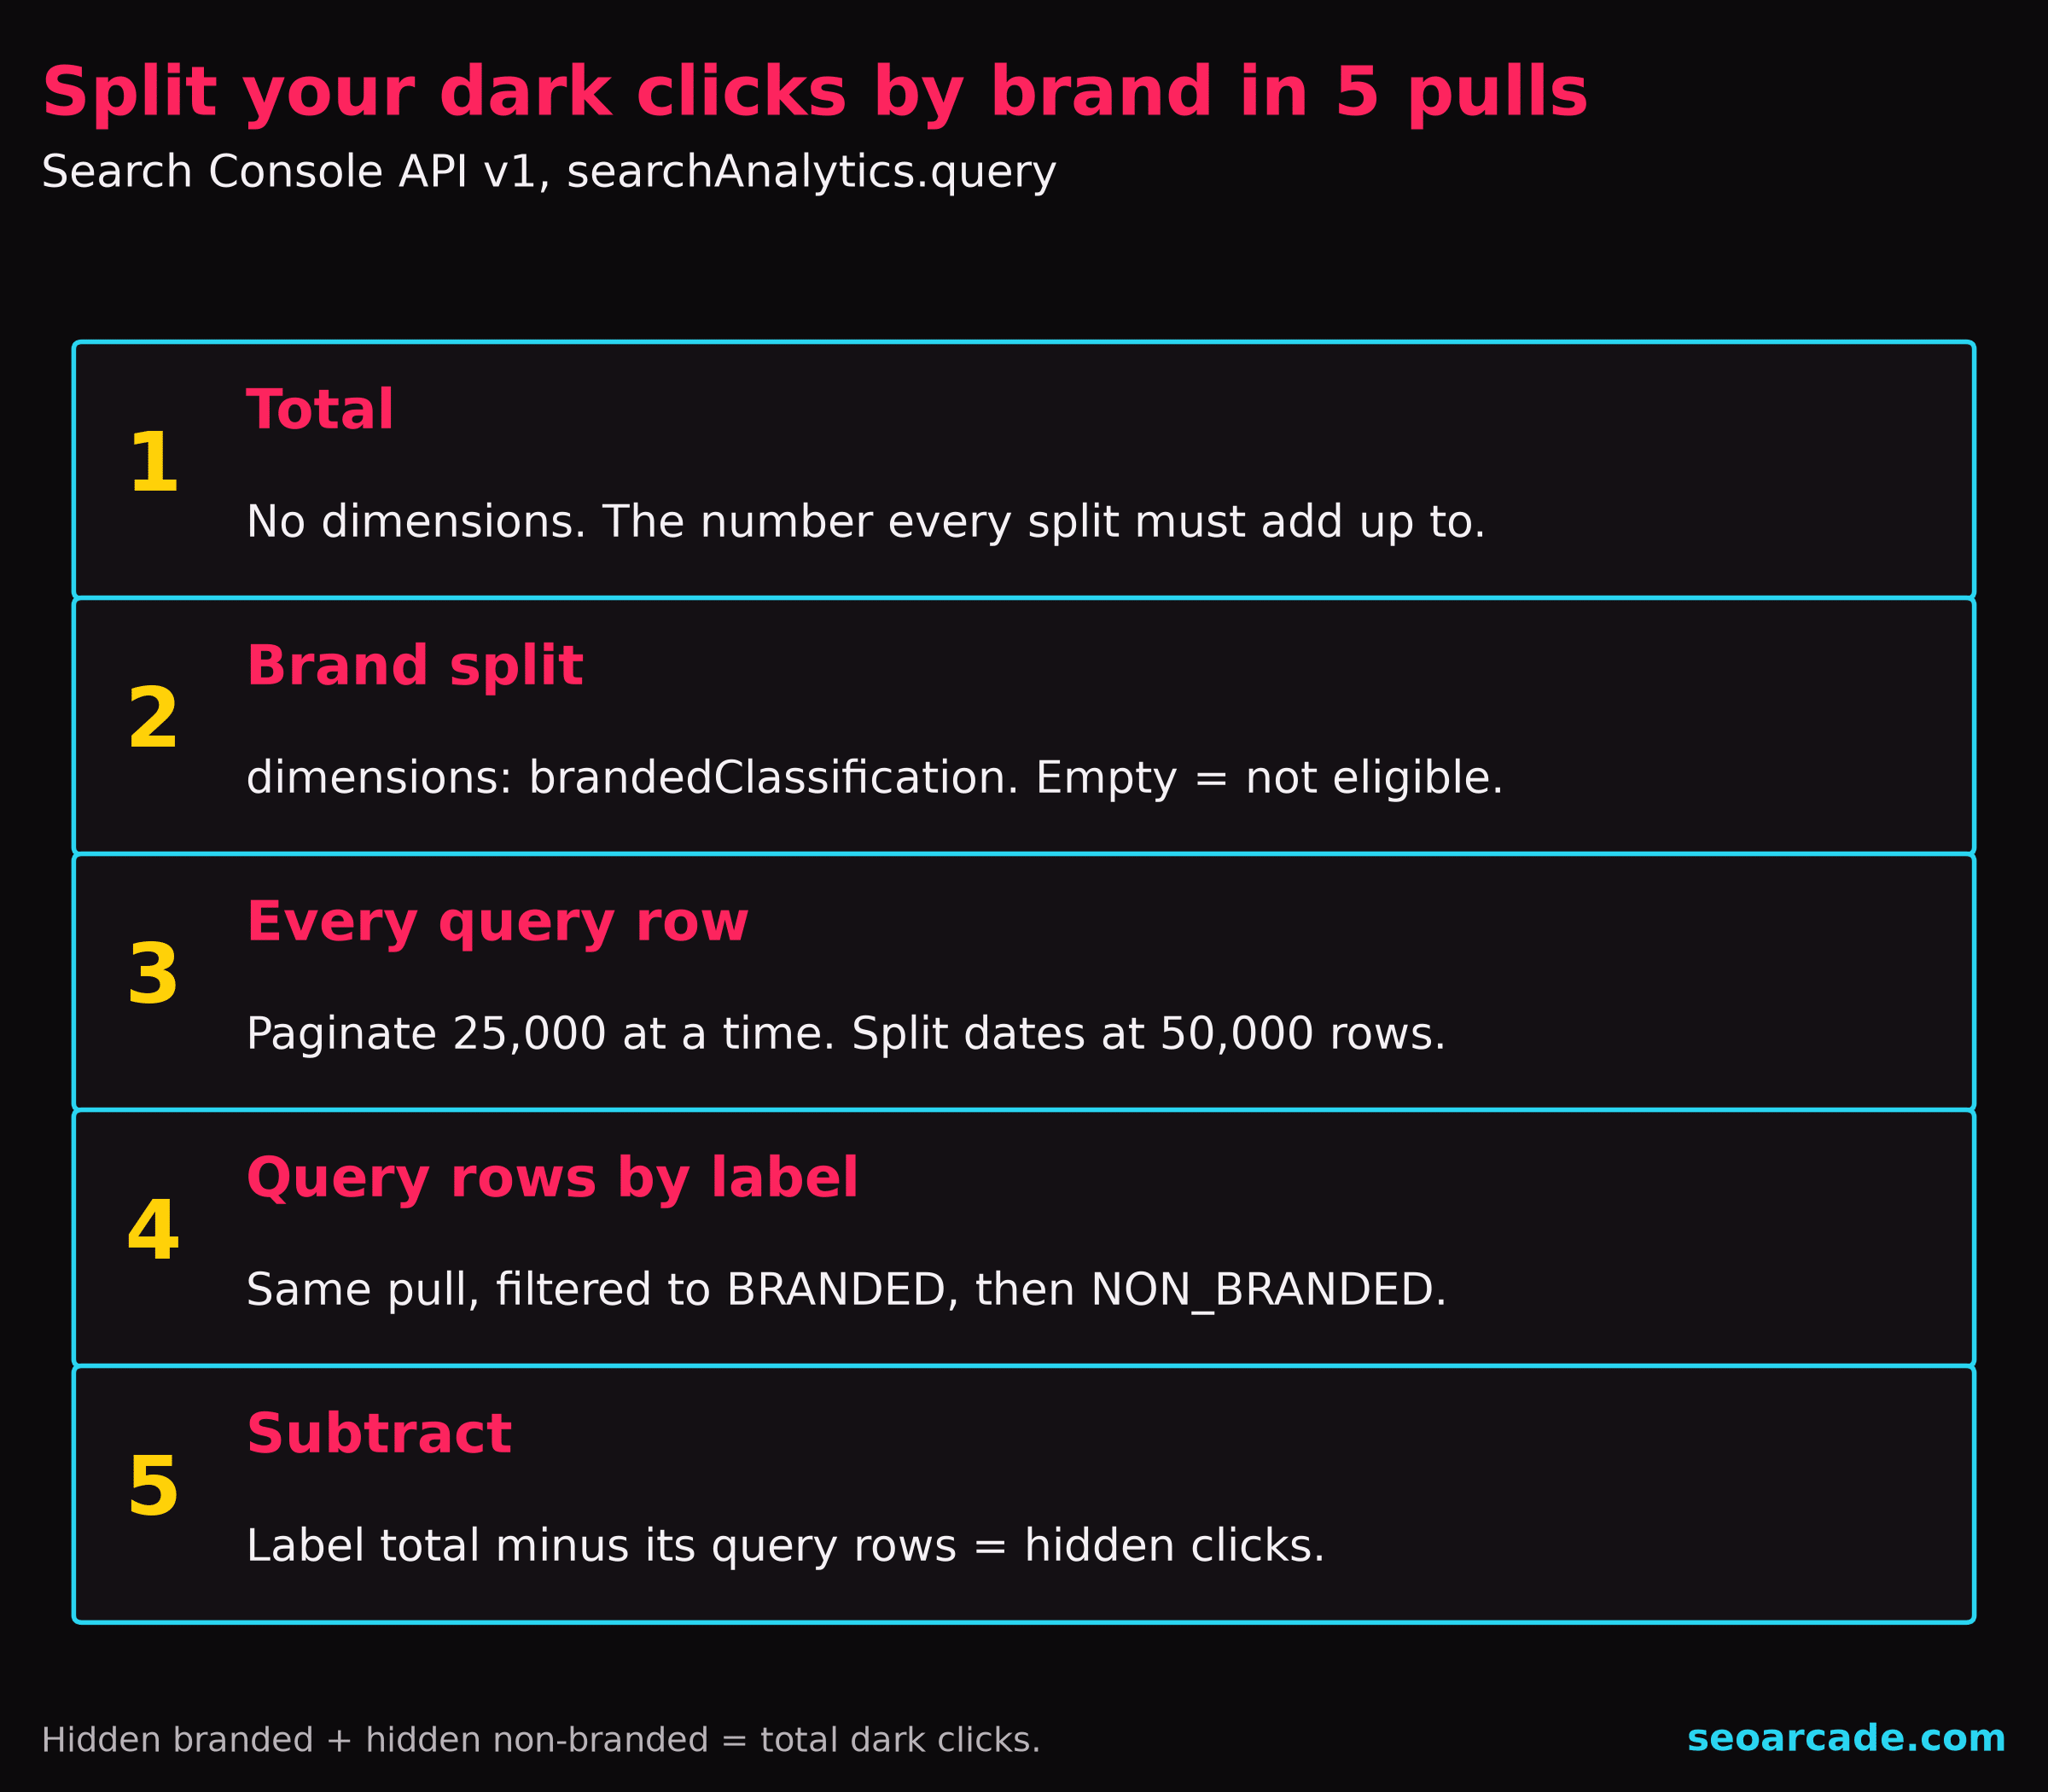
You don’t need a vendor for this. If you can call the Search Console API (or wire it into Claude through one of the Search Console MCP servers), you can run the whole split. Here’s the method I used:
- Pull the property total with no dimensions for your date range.
- Pull the brand split with
dimensions: ["brandedClassification"]. If it comes back empty, the property isn’t eligible. Check that the total isn’t also empty before you write anything down. - Sum every query row with
dimensions: ["query"], paginating 25,000 rows at a time until a page comes back short. Never stop at the top 1,000; the rows come sorted by clicks, so a cutoff drops the long tail first. - Repeat step 3 twice, once with a filter of
brandedClassification equals BRANDEDand once withNON_BRANDED. - Do the subtraction. Hidden branded clicks = branded total minus branded query rows. Same for non-branded. Their sum should equal your total dark clicks.
{
  "startDate": "2026-02-21",
  "endDate": "2026-11-15",
  "dimensions": ["query"],
  "rowLimit": 25000,
  "startRow": 0,
  "dimensionFilterGroups": [{
    "filters": [{
      "dimension": "brandedClassification",
      "operator": "equals",
      "expression": "BRANDED"
    }]
  }]
}
One more tip from doing this across a big account: the API caps a single date range at about 50,000 query rows. If a pull hits that, split the date range and add the pieces together, or your “visible” number comes up short and your dark number comes up long. The triangulated GA4, GSC and Clarity dashboard in the tactic library is a good home for the result, and the Search Console resource guide has the rest of the API plumbing.
How I measured it
Search Console API v1 as one account with access to 94 properties (27 domain, 67 URL-prefix). Search type web, final data. Windows: February 21 to November 15, 2026 (the full branded era), August 16 to November 15 (last three months) and July 19, 2025 to November 15, 2026 (16 months). Query sums were paginated to exhaustion, with date ranges split until no piece reached 50,000 rows. Site-level stats use eligible properties with 30+ clicks; when a site had both a domain and a URL-prefix property, only the domain property counts. Sites other than mine are anonymized by type. The full dataset (JSON and CSV) is kept with the dark-click study files, and this is a sample of one account’s properties, not the web.
Report branded and non-branded search separately, starting this month
So what do you do with it? You split every Search Console report you send into two lines, and you stop pretending the visible queries tell you the brand story. Then you start asking better questions. Is your non-branded line growing because of content, or did one page catch a lucky query? When you got that podcast feature or that PR hit, did the branded line move at all? How much of your “SEO growth” last year was people who already knew your name? And if the branded share of your dark clicks is tiny, what are those thousands of hidden non-branded searches, and which pages are catching them?
I don’t have the answer to that last one for your site, but you can find the pages with the page dimension, which does combine with the brand label. If you want the split run on your own properties, or turned into a forecast you can defend, here’s how to work with me.