
How many of your Search Console clicks actually come with a query attached to them?
You probably assume most of them do, because that is what the screen looks like. You open the queries report, you sort by clicks, you scroll, and nothing in that interface tells you the list is incomplete. Google does say so in the documentation, quietly, in the line about anonymised queries that nobody reads twice.
Here’s what happens when you actually go and check. (For the 38-site, 12-month version, see dark clicks in GSC are blinding your SEO campaign.)
Why Your Search Console Clicks Don’t Match Your Query Report
I said this on the show with Rob Bonham, and if you have ever drilled into a page-level query report you already know the feeling:
“That little table full of clicks for your queries, that ain’t 400 clicks worth of information. If you’re lucky, maybe 60%. Maybe. I have one, ironically, a ranking blog post about how Google Search Console data isn’t reliable. Guess how many of those 50 clicks I have query data for? Four. Four.”
Rob had already guessed before I said the number. “Five. I wasn’t far off.” Then he described the exact move you have almost certainly made yourself:
“I’ll go on the pages report and be like, okay, each one of these pages has two hundred, three hundred clicks, then I go drill down, take a look at a query report for that URL, and I’m like, where’s all my clicks? Who moved my clicks?“
You shrug, you close the tab, and you get on with your day. I did that for years and so did he.
Dark Clicks: How Much Query Data Search Console Hides
I called these dark clicks and named them properly in a conversation with David Wilson. On my own site the gap was 34% across the property and about 95% on one page, but one site proves nothing, so I went and measured every Search Console property I have access to. Thirty-five of them with enough traffic to count, six months each, total clicks against the sum of that property’s own query table.

The median property attaches a query to 34.9% of its clicks. Two out of every three clicks you have been reporting on arrive with nothing in the query column at all, and if you have never checked your own number you have no idea which side of that median you are sitting on.
- 926,819 clicks across the portfolio carry no query.
- 29 of 35 properties come in under 60% coverage.
- Zero properties cleared 95%.
- My own sites are the worst in the set. unscriptedseo.com attaches a query to 15.1% of its clicks, and the asphalt site manages 10.3%.
The smaller the site, the worse the coverage gets, which is backwards from how you would want it to work. Small sites are exactly the ones making strategy decisions off eleven queries and a hunch.
Page Report vs Query Report: Which One Shows All Your Clicks
Matt Mellinger co-founded SEO Gets, so he looks at this from inside the API rather than from the dashboard, and on the show he put a range on it from his own case study. Exported queries account for as little as 5% on a very small site and at most around 70%. Then he handed over the part you can act on:
“If you look at the page level, it shows you 100% of the clicks almost every time.”
— Matt Mellinger
I had no way to test that when he said it, so I ran it. Same 35 properties, same six months, same totals, pulled by page instead of by query.
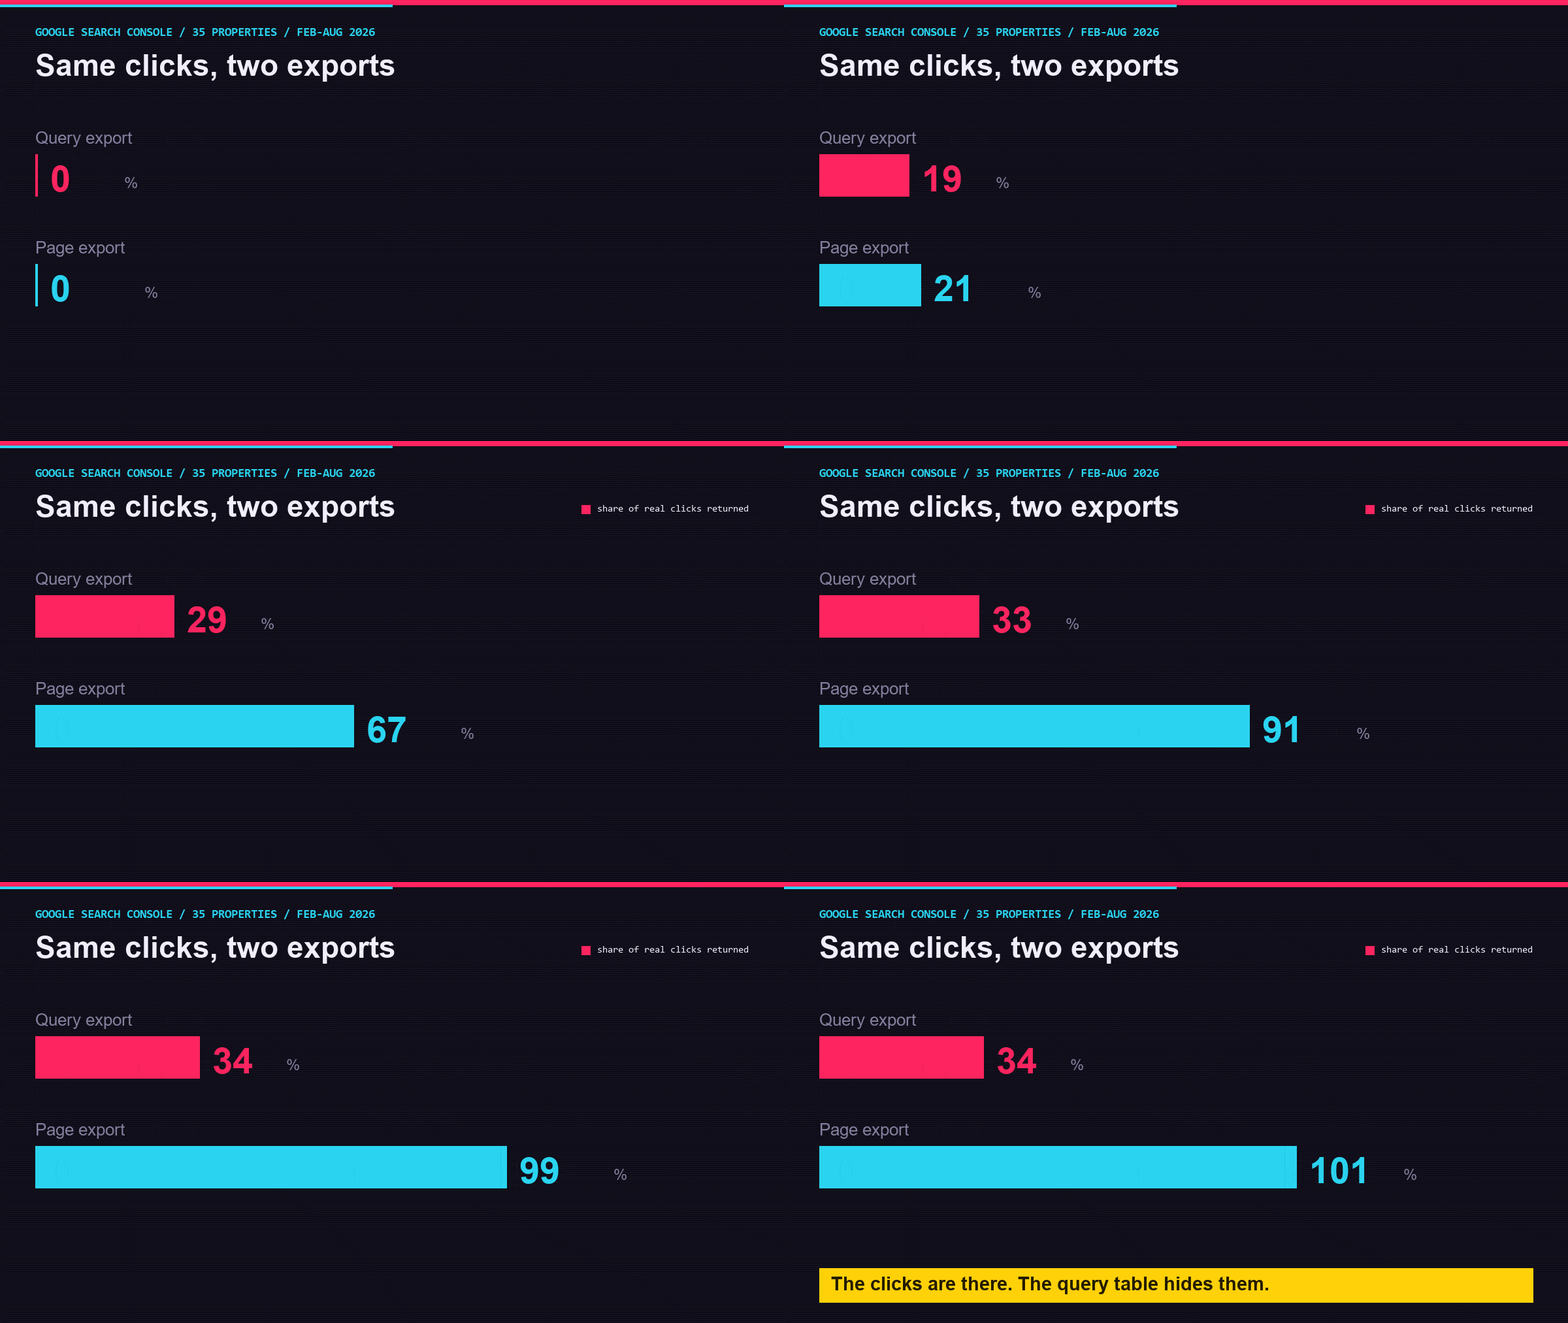
Median page coverage came in at 101.2%. All 35 properties cleared 95% on the page dimension and not one of them cleared it on the query dimension, so this is not an occasional quirk you can design around. His range held up too: he said 5% to about 70% and mine came out 10.3% to 92.7%, off a completely different sample.
You will see coverage tick slightly past 100% (a click can land against more than one page, and there is rounding at the date boundaries) and that is worth naming rather than hiding, because it does not change the shape of the thing.
How To Measure Your Own Search Console Query Coverage
You are not getting the missing queries back, and Google is not going to hand them over. What you can do is stop building arguments on the dimension that loses two thirds of the evidence.
- Count clicks at the page level, every time. If you need to know what a page earned, the page report knows and the query report does not. This is the single change with the biggest payoff and it costs you nothing.
- Measure your own coverage before you trust any query-level conclusion. Take total clicks, sum your query table, divide. If you land at 20%, then every query-level story you have been telling is a story about a fifth of your traffic.
- Put that coverage number in the client report. Not as an apology, as context. Here is what we can see and here is what Google withheld is a far more honest slide than a query table quietly pretending to be complete.
- Stop filtering brand out at the query level. I used to do exactly this and said so on the show with Ann Smarty. When two thirds of your clicks carry no query you cannot split brand from non-brand in that table, because you do not know what the missing two thirds were.
If you want the prompts for running this yourself they are in the three-prompt post from earlier this week, and you can bolt one more onto the pile: “Sum the clicks in my query export, compare it against the total clicks for the property over the same range, and give me the percentage.”
What Missing Query Data Breaks In Your Client Reporting
If the query table only carries a third of your clicks, and average position is not really a position, then your query-level CTR is being computed on a third of the data. So what has your monthly CTR report actually been measuring? How many of the decisions in your last quarterly deck rest on a table that was never complete? And which of your clients would still approve that budget if you showed them the coverage number first?
I have been sending those reports for years. So has Rob, and so have you. Go pull your own coverage number before your next client call, and then decide how you feel about that slide.