
Unfortunately, the primary data source we’re provided from Google about our search performance on their site is inaccurate, incomplete, and obscured. I tweeted out a simple request for a quote for another story I was working on about how to leverage GSC data and its potential inaccuracy. I was blown away by the variety of ways my fellow experts discovered the unreliability of the data provided.
I’ve ironically updated this article to include my OWN stats for this very post, where it got 148 clicks in GSC, but only got detail for 5 of those clicks over the last 3 months of data collection. That is just THREE PERCENT of the clicks reported, and ONE query is defined as receiving those clicks!
Google Business Profile Clicks Not Included
Watch: Gert Mellak on why a chunk of what Search Console shows you is bots.
It looks like a huge amount of traffic from the Google Business Profile from mobile is completely missing in Search Console, and some data from desktop. I believe one possible reason for this is that when you click on a listing in the 3-pack on mobile, you get a URL string that says Google/localservices/profile whereas on a computer you get Google/search.
Joy Hawkins
I worked with a compression glove ecommerce site, helping people with arthritis, and they had 201 clicks at the top of the chart. However, it only gave detail for 96 total clicks. That’s nearly 50%. A literal 50/50!
Google Search Console Data is Limited in the UI, AND “Sampled”
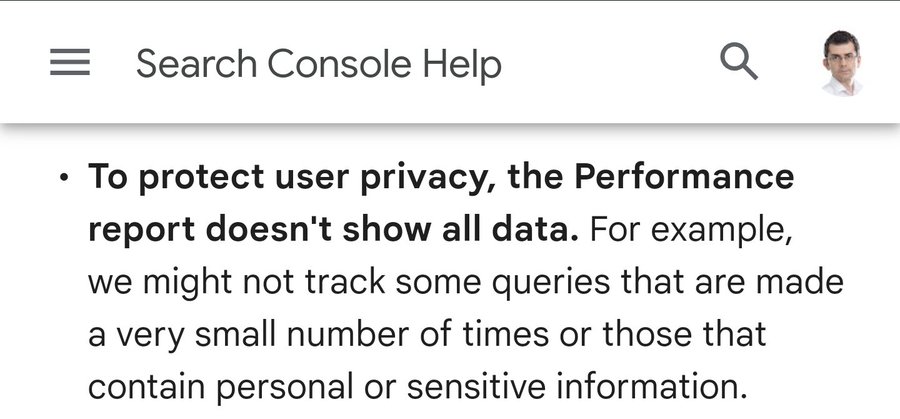
If you thought that Google had decided to share “the whole picture” with you, when it comes to GSC data, you’ve got two major problems to resolve. They withhold query data for “black box” reasons and also limit your access to the data through their UI interface.
Both the data in the report interface and the data exported are aggregated and filtered in different ways. Below are the two main limitations to the data: privacy filtering and daily data row limit.
Google Search Central Blog
- There is no row for anonymized queries in the report table or API (added here for illustration purposes), so if you sum up clicks for all the rows, you’ll not find the same number of clicks as the chart totals. For example in this case you’d see 450 when you sum up the rows, but you’d see 550 in the chart totals.
- The anonymized queries are omitted whenever a filter is applied, so there will be a discrepancy if you compare the sum of clicks in the chart totals to the sum of clicks containing
some_stringand not containingsome_string. In this case, if you use filters to include only queries that contain the word “fiction”, you’ll see 175 clicks, and if you exclude queries that contain the word “fiction”, you’ll see 275 clicks, summing up to 450 clicks, while in the chart total you’ll see 550 clicks.- Due to limitations related to serving latency, storage, processing resources, and others, Search Console has a limit on the amount of data that can be displayed or exported. The maximum you can export through the Search Console user interface is 1,000 rows of data.
Even If You Use The API – It’s Not The Whole Picture
Understanding the Limitations of Google Search Console Data Accuracy
- Data Sampling: Google Search Console may sample your data in order to speed up data processing. This implies that Google will only utilize a subset of your website data to represent the complete dataset, which may result in erroneous statistics if the sample size is insufficient.
- Click Data: The click data provided by Google Search Console is based on the number of clicks registered by Google when people click on your website in the search results. Nevertheless, not all clicks are logged, which might lead to data disparities. Google, for example, may not register clicks on highlighted snippets or photos, resulting in reduced click counts in the report.
- Reporting Delays: Because Google Search Console data is not real-time, it may not be up to current at the time of analysis. Google may require some time to process the data and update the reports, resulting in reporting delays.
- Data Aggregation: Google Search Console aggregates data at many levels, including website, page, and query. This implies that certain data may be mixed or clubbed together, resulting in data errors. Data from several pages of your website, for example, may be aggregated into a single report, making it impossible to assess the performance of particular pages.
Solutions to Address Inaccurate Data in Google Search Console
- Utilize other analytics tools: Website owners may use other analytics tools like Google Analytics or third-party tools like SEMrush or Ahrefs to cross-check the data in Google Search Console. Website owners can compare data and find differences by utilizing several tools. Tools like SEOGets can also help you with some of the data hassle associated with Google Search Console.
- Examine tracking code implementation: If the data in Google Search Console is incorrect, it might be due to tracking code implementation difficulties. Website owners should check their tracking code to ensure that it is correctly installed and set.
- While Google Search Console gives statistics on impressions and clicks, it does not provide information on search engine rankings. Website owners should check changes in search engine rankings over time using tools like Google Search or third-party solutions.
- Consider user behavior: Google Search Console gives statistics on clicks and impressions, but not on user behavior on the site. Other metrics, including bounce rate, time on site, and conversion rate, should be considered by website owners to gain a more full view of their site’s success.
- Watch for patterns over time: Webmasters should keep an eye out for trends over time rather than just concentrating on Google Search Console’s exact figures. Website owners may see trends and decide how best to optimize their site by tracking changes in traffic, click-through rate, and other data over time.
Why Context Matters When Analyzing Data in Google Search Console
When analyzing data in Google Search Console, it’s important to consider the context in which the data is being collected. This means taking into account factors like seasonal fluctuations, website updates, algorithm updates, and industry trends. For example, a website may experience a dip in traffic during a slow season for their industry, or a change in search engine rankings due to an algorithm update. By considering these factors, website owners can get a more complete picture of their site’s performance and make informed decisions about optimizing their site.
Contextualizing the data in Google Search Console can help website owners identify patterns and make data-driven decisions. By understanding the factors that may impact their site’s performance, website owners can make adjustments to their strategy and measure the impact of those changes. Ultimately, this can help website owners improve their search engine rankings, drive more traffic to their sites, and achieve their business goals.
Jeremy’s 2026 Refresh: The Gaps Got Wider in the AI-Overview Era
When I first wrote this, the headline problem was anonymized “not-provided” queries and the 1,000-row export cap. In 2026 those gaps haven’t closed, they’ve widened. AI Overviews now eat a huge slice of impressions where your page is technically “seen” inside the generated answer but never clicked, so your impression count balloons while CTR craters and Search Console still hands you a single mystery row for the queries that actually drove the visit. If you take GSC clicks at face value, you’ll badly under-count branded and long-tail demand and badly over-react to a CTR drop that’s really just the SERP swallowing the click. The honest move is to treat GSC as a directional sample, not a ledger, and to reconstruct the missing slice deliberately. That’s the whole reason I built what I call the Degapinator: a workflow that triangulates the anonymized rows by cross-referencing page-level totals against query-level detail, filtered exports, and third-party rank data to infer which queries are hiding inside that “anonymous” bucket. I dig into this proxy-data mindset with Grant Simmons in our conversation on entity SEO, LLMs, and the future of search visibility, because once an LLM is the surface, “position” and “clicks” stop meaning what they used to.
Practically: pull your data by page first, not by query, then diff the page total against the sum of named queries to size your anonymized gap before you trust any single number. Google’s own Performance report documentation now openly states the chart totals and table totals differ due to aggregation and privacy filtering, so the discrepancy isn’t a bug you can fix, it’s a permanent feature you have to model around. Segment aggressively with regex, watch trends over absolute figures, and rebuild the not-provided picture instead of pretending it isn’t there.
Related on SEO Arcade
- GSC regex for custom data segmentation
- SEO forecast reports and Google traffic predictions
- the complete SEO knowledge hub
Regex Does Not Fix Inaccurate Data. It Makes It Legible.
Custom regex filters are the standard answer to everything above. Segment branded from unbranded, isolate questions, split a section of the site, and suddenly the Performance report tells you something. That is real, and it is the single most useful thing in Search Console.
It is also worth being clear about what regex does not do. A filter cannot recover data Google never gave you. Anonymised and low-volume queries are withheld before you ever open the report, so every regex you write runs against an already incomplete table. Filter a partial dataset and you get a cleaner view of a partial dataset. Three specific traps follow from that:
- Percentages built on filters inherit the gap. If 40% of your clicks have no named query, a “branded vs non-brand” split calculated from named queries alone is a split of the visible 60%, not of your traffic.
- Half the regex in circulation cannot run. Search Console uses Google’s RE2 engine, which has no lookaheads, no lookbehinds and no backreferences. The widely copied
^(?!.*(brand)).*$exclusion pattern is not doing what people think it is doing. A pattern that silently returns nothing looks identical to a segment with no traffic. - Matching is partial by default. Without
^,$or\b, a brand filter for a short name quietly swallows unrelated queries and inflates the branded half of your report.
A live example: 1,096 impressions for a keyword with 160 searches
Here is one from this site, found while writing the regex guide linked below.
Keyword research tools report the term “google search console regex” at roughly 10 searches a month in the United States. Over a 16-month window that is about 160 searches total.
Over that same 16 months, this site’s Search Console recorded 1,491 impressions for that exact query, 1,096 of them from the United States. All of it from a single URL, so there is no second page multiplying the count.

One search can produce at most one impression for one URL. So either at least 1,096 US searches happened and the tool is understating volume by roughly seven times, or Search Console is counting impressions that do not correspond to searches.
Those are the only two options, and nothing available to us can tell which one is true. That is the whole problem with this data in one number.
“But tool volume is US-only and impressions are global”
This is the first reply everyone reaches for, and it does not survive contact with the data. “Global” is not a market. Global search is fractured across languages and regions, and Search Console hands you the country dimension precisely so you can take it apart. So take it apart. Here is where all 1,491 impressions actually came from:
| Country | Impressions | Share |
|---|---|---|
| United States | 1,096 | 73.5% |
| Denmark | 109 | 7.3% |
| Brazil | 41 | 2.7% |
| Russia | 32 | 2.1% |
| United Kingdom | 27 | 1.8% |
| India | 17 | 1.1% |
| The other 66 countries, mostly 1 to 5 impressions each | 169 | 11.3% |
| 72 countries total | 1,491 | 100% |
Three quarters of the impressions are American, and the comparison above was already US-to-US. The entire rest of the world contributes 395 impressions spread across 71 countries, most of them in single digits. There is no hidden pool of foreign demand that rescues the estimate, and the country filter is right there for anyone who wants to check the same thing on their own property.
The other usual explanation, that impressions include results nobody scrolled far enough to see, is exactly the point rather than a defence. If an impression does not reliably correspond to a search, then volume estimates and impression counts are measuring two different things while being presented side by side as if they were comparable.
Have you seen this on your own properties? It is easy to check: pick a query where you have real impressions, look up its reported volume, and compare like for like on country. We would genuinely like to know how common it is.
If you want the patterns themselves, including which ones actually run in RE2 and which silently fail, that is all in the Google Search Console Regex Library, and everything else we have written on this data is collected in the Search Console resource guide.