
What’s your click-through rate at position 4?
If you just thought of a number, it came from a study. Somebody averaged a few hundred sites, published a curve, and that curve has been quoted in every forecast deck since. The 2026 versions put position 1 somewhere between 19% and 39.8% depending on whose you read, which should tell you something about how much the average is worth to you.
Here’s the thing — you don’t need the average. You have your own numbers sitting in Search Console right now, and you can pull the useful cuts with three prompts. I’ve been running these across 47 properties for the last two days and they hold up.
First, split brand off the top
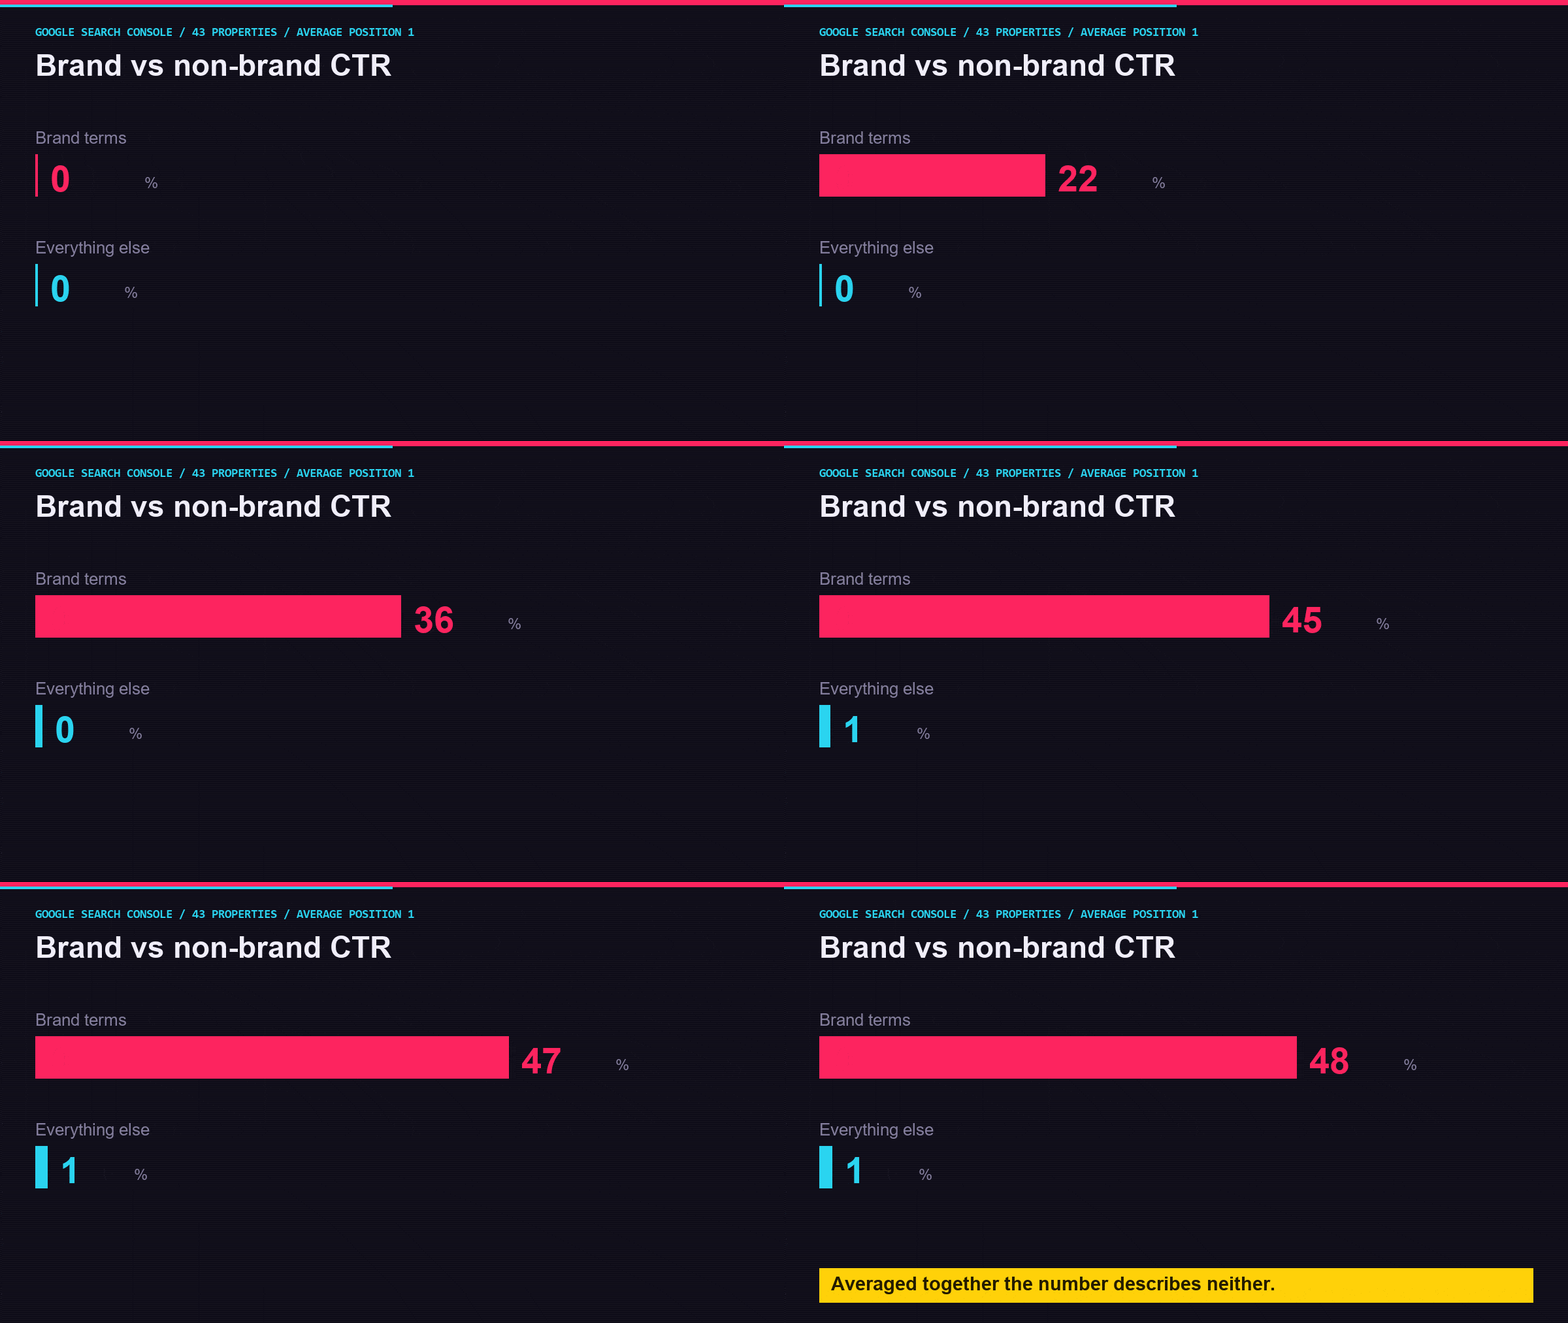
This is the one that changes how you read everything else. Your brand terms convert at 40% or 50%. Your non-brand terms convert at 1%. Mash them together and you get a site-wide CTR that describes neither, and it moves whenever your brand traffic moves.
Here's my Search Console query export. Split every query into two
buckets: brand (contains my company name or a misspelling of it)
and non-brand. Give me clicks, impressions and CTR for each bucket,
plus what share of total clicks is brand.

Then tell me the same thing for the same date range last year.
Run this before anything else. It reframes every other number.
Most people are surprised by the share. If 60% of your clicks are people typing your name, you don’t have an SEO channel that’s working, you have a brand that’s working and an SEO channel you haven’t measured yet.
Then find the pages you rank for and nobody clicks
This is where the money is, and it takes about ten seconds.
From this Search Console export, show me every query where:
- average position is better than 10
- impressions are over 500
- CTR is under 1%

Sort by impressions descending. For each one, show the query,
the page, the position and the CTR.
You want the ones near the top of the list. Those are titles, not rankings.
You already earned the visibility on these. Somebody put you on the first screen and the click went somewhere else. That’s a title and description problem, and it’s the cheapest fix in SEO because you don’t have to build anything or wait for anything.
Then compare yourself to yourself, carefully
Year-over-year CTR is where most reporting goes wrong, and it goes wrong in a specific way that’s easy to avoid once you know about it.
I have two Search Console exports, this year and last year.

Match them on the exact query string. Only keep queries that
appear in BOTH exports with at least 30 impressions in each,
AND where average position moved by less than 1.0.

For that matched set only, show me CTR then, CTR now, and the
change. Ignore every query that isn't in both.
The matching rules are the whole point. Without them you’re measuring your own churn.
If you skip the matching, you’re comparing two different sets of queries and calling the difference a decline. I built a chart last week showing CTR had collapsed 51% at position 3. Once I matched the queries and held the rank still, most of it turned out to be new terms entering the bucket. The finding evaporated, which was annoying, but publishing it would have been worse.
One thing you can’t ask for
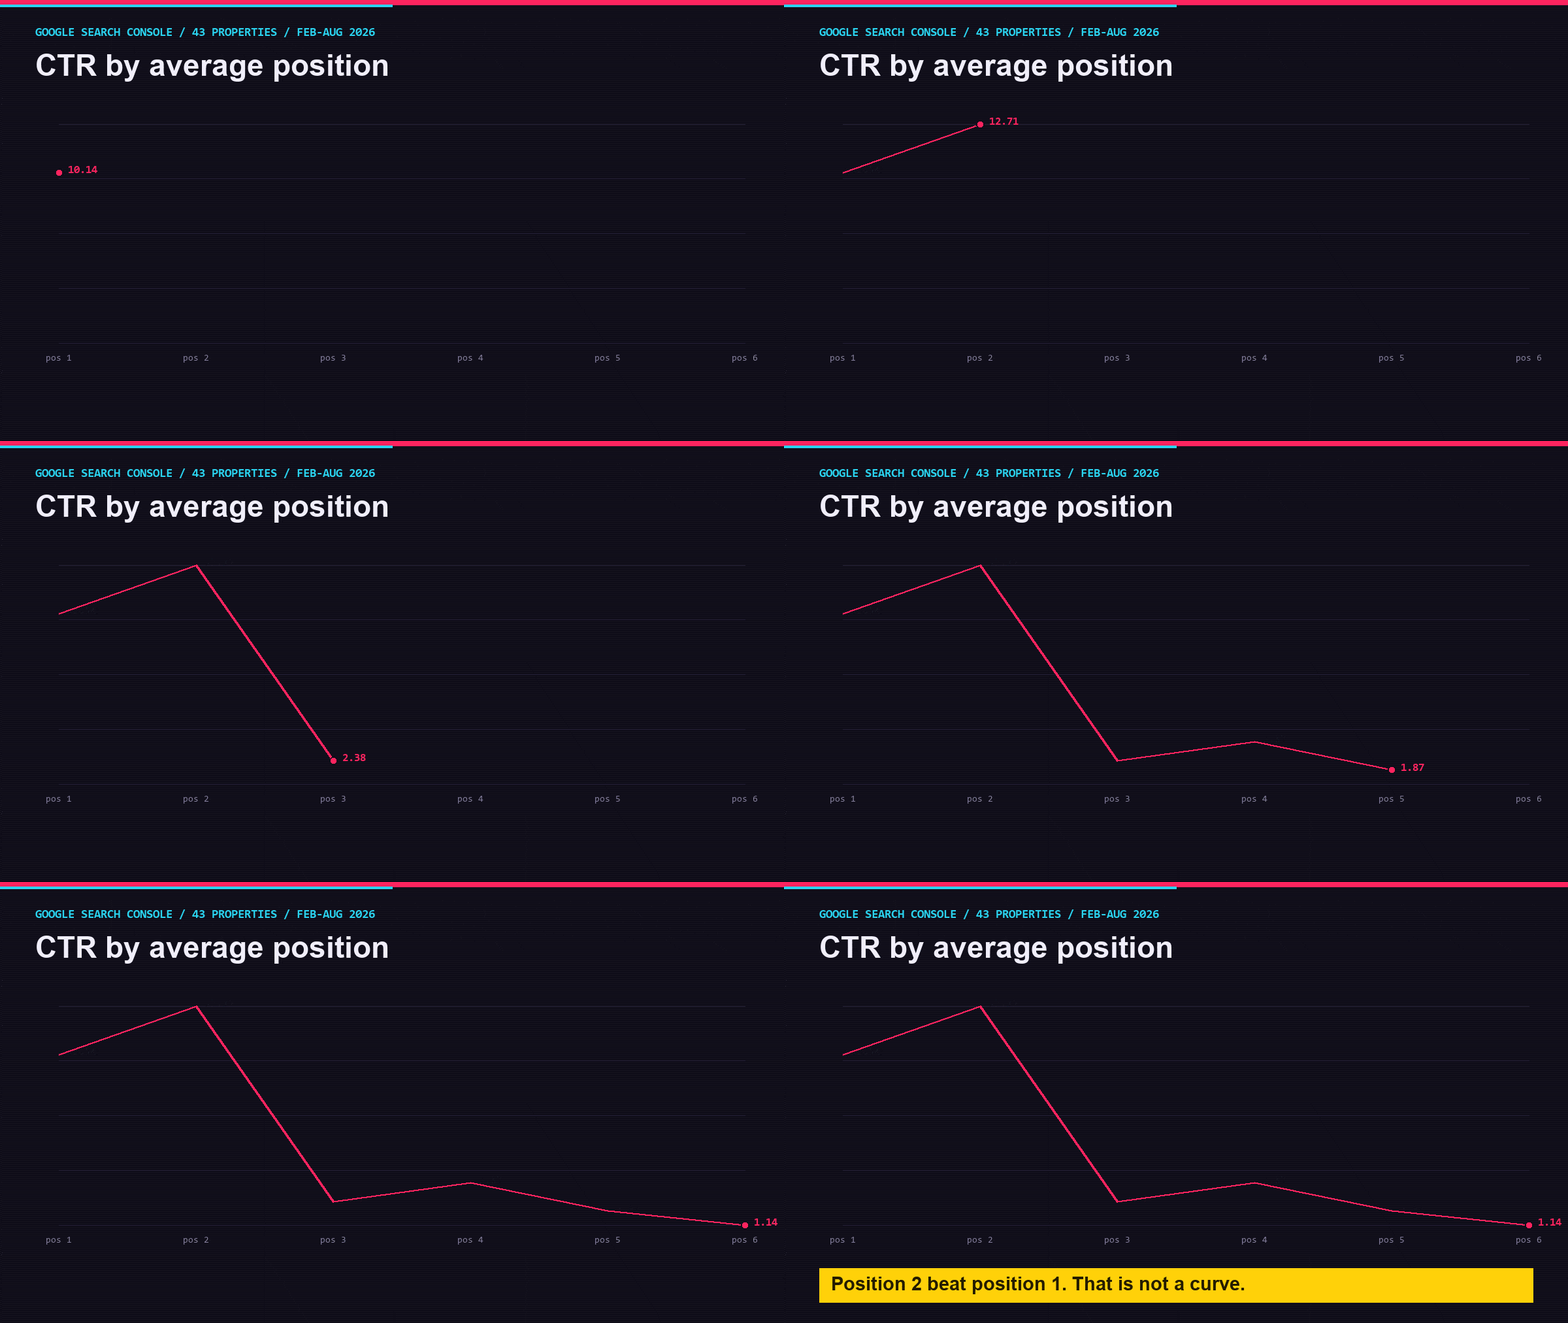
Don’t ask any of these tools to build you a CTR-by-position curve from Search Console. It’ll happily produce one and it will be wrong.
Search Console reports average position, which is a mean across every impression a query got. A term averaging 2.0 might rank 1 on mobile and 3 on desktop. Those aren’t comparable to each other and they don’t stack into a curve. When I tried it on my own data, position 2 came out with a higher CTR than position 1, which is the tool telling you it isn’t measuring rank.
Where this leaves you
You can measure change in Search Console if you control for the population and the rank. You can measure a specific query at a specific time, and you can trust that. What you can’t do is measure the level, the “what is position 4 worth” question, because the data doesn’t carry a real rank to hang it on.
Which raises a question I genuinely don’t have a good answer to yet. If the level isn’t measurable and the change requires three controls to be honest, what has your monthly CTR report actually been telling your client? I’ve been sending those for years. Go pull last month’s, run the matched-query prompt against it, and see whether the story survives.