
Is Google Search Console accurate? Google’s documentation defines a click as “the number of clicks from Google Search results to your site.” That reads like a count. It isn’t one, and the number you are reporting to your clients is probably low.
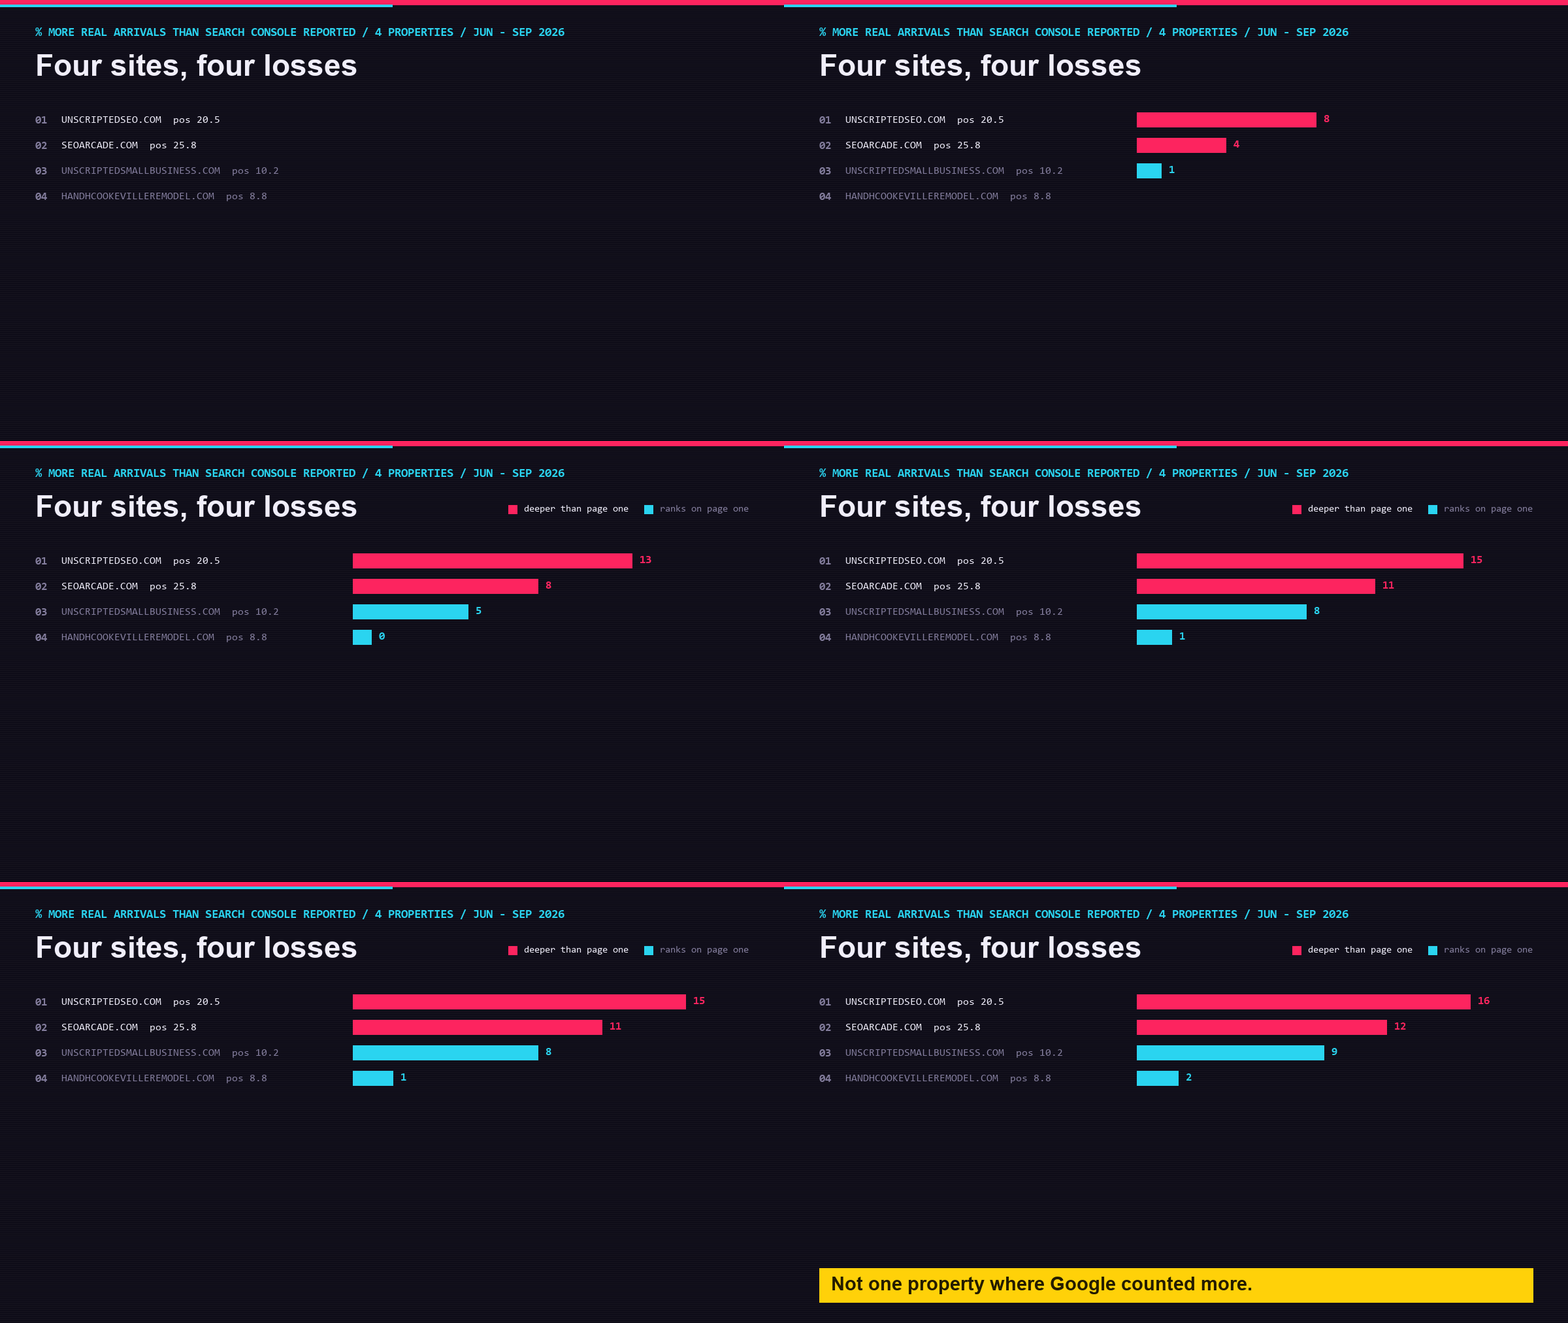
I spent a day comparing Search Console against Microsoft Clarity across four sites I own. Clarity counted more people arriving from google.com than Search Console reported clicks. Every site. Not once did Google come out ahead. I measured the gap across the four at 9.6%, running from 2% to 16%.
You can check this on your own site in about twenty minutes. You should, because if it holds on yours then every performance report you have sent understates the result.
This is not the dark clicks problem you already know about
You know Search Console hides things. When you add up your query-level clicks they never reach your property total, because Google withholds queries made by very few people. On seoarcade.com that hole is enormous – 276 clicks attributed to named queries against 629 for the property.
The OpenSEO team wrote the clearest version of this in The Dark Query Problem, and their framing is the one you have internalised: Google shows you the clicks but hides the questions behind them. Their striking-distance guide rests on the same assumption, that your Search Console is the one keyword database built from people who actually reached you. I went looking for my own missing clicks on the same premise.
That gap is real and it is not what I am writing about. My problem is with the premise underneath all of it, and I say this as someone who published the same premise myself: it is a thing none of us checked.
Google shows you the clicks. But does it show you all of them?
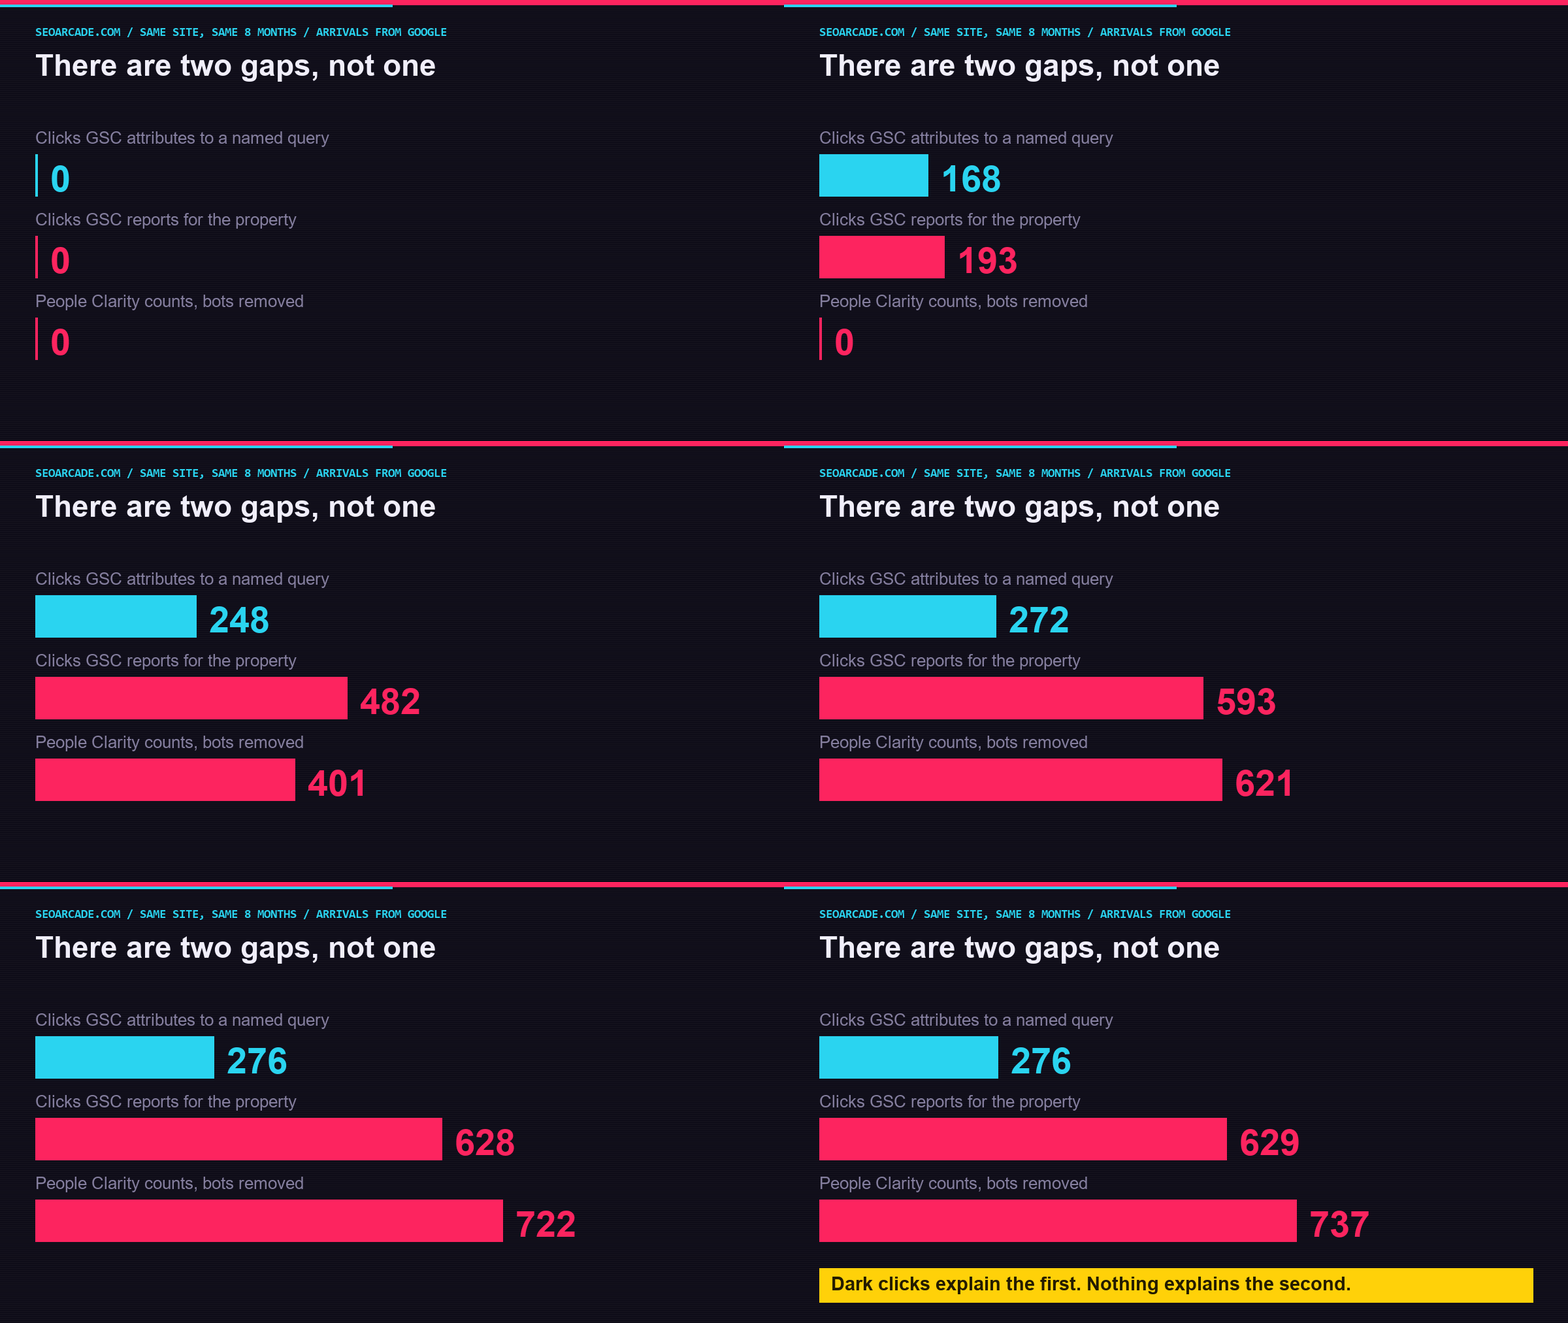
The second gap sits on top of the first. It is the distance between the property-level number Google publishes – the 629 – and the 737 real humans a non-Google tracker counted arriving from google.com over the same window. Dark queries explain why your query list is short. Nothing published explains why your click total is short.
How accurate is Google Search Console against a third party?
Here is what I got from four properties over one aligned 92-day window. I summed Search Console clicks across every search surface, then set Clarity to a google.com referrer with its bots removed.
- handhcookevilleremodel.com – avg position 8.8 – 166 clicks, 170 people – 1.02x
- unscriptedsmallbusiness.com – avg position 10.2 – 278 clicks, 303 people – 1.09x
- unscriptedseo.com – avg position 20.5 – 127 clicks, 147 people – 1.16x
- seoarcade.com – avg position 25.8 – 239 clicks, 268 people – 1.12x
810 clicks reported. 888 people counted. Notice where the gaps sit: the two sites that rank on page one show the smallest, and the two that rank deeper show the biggest. Be careful with that, because four sites cannot establish a trend and the pattern is not even clean – position 20.5 came out worse than position 25.8. What four sites can establish is direction, and the direction never reversed.
Everything you should try to blame it on first
I did not want this to be true, so I spent most of the day trying to kill it. Work through the same list before you believe anything, because each of these produces the same result for a dull reason.
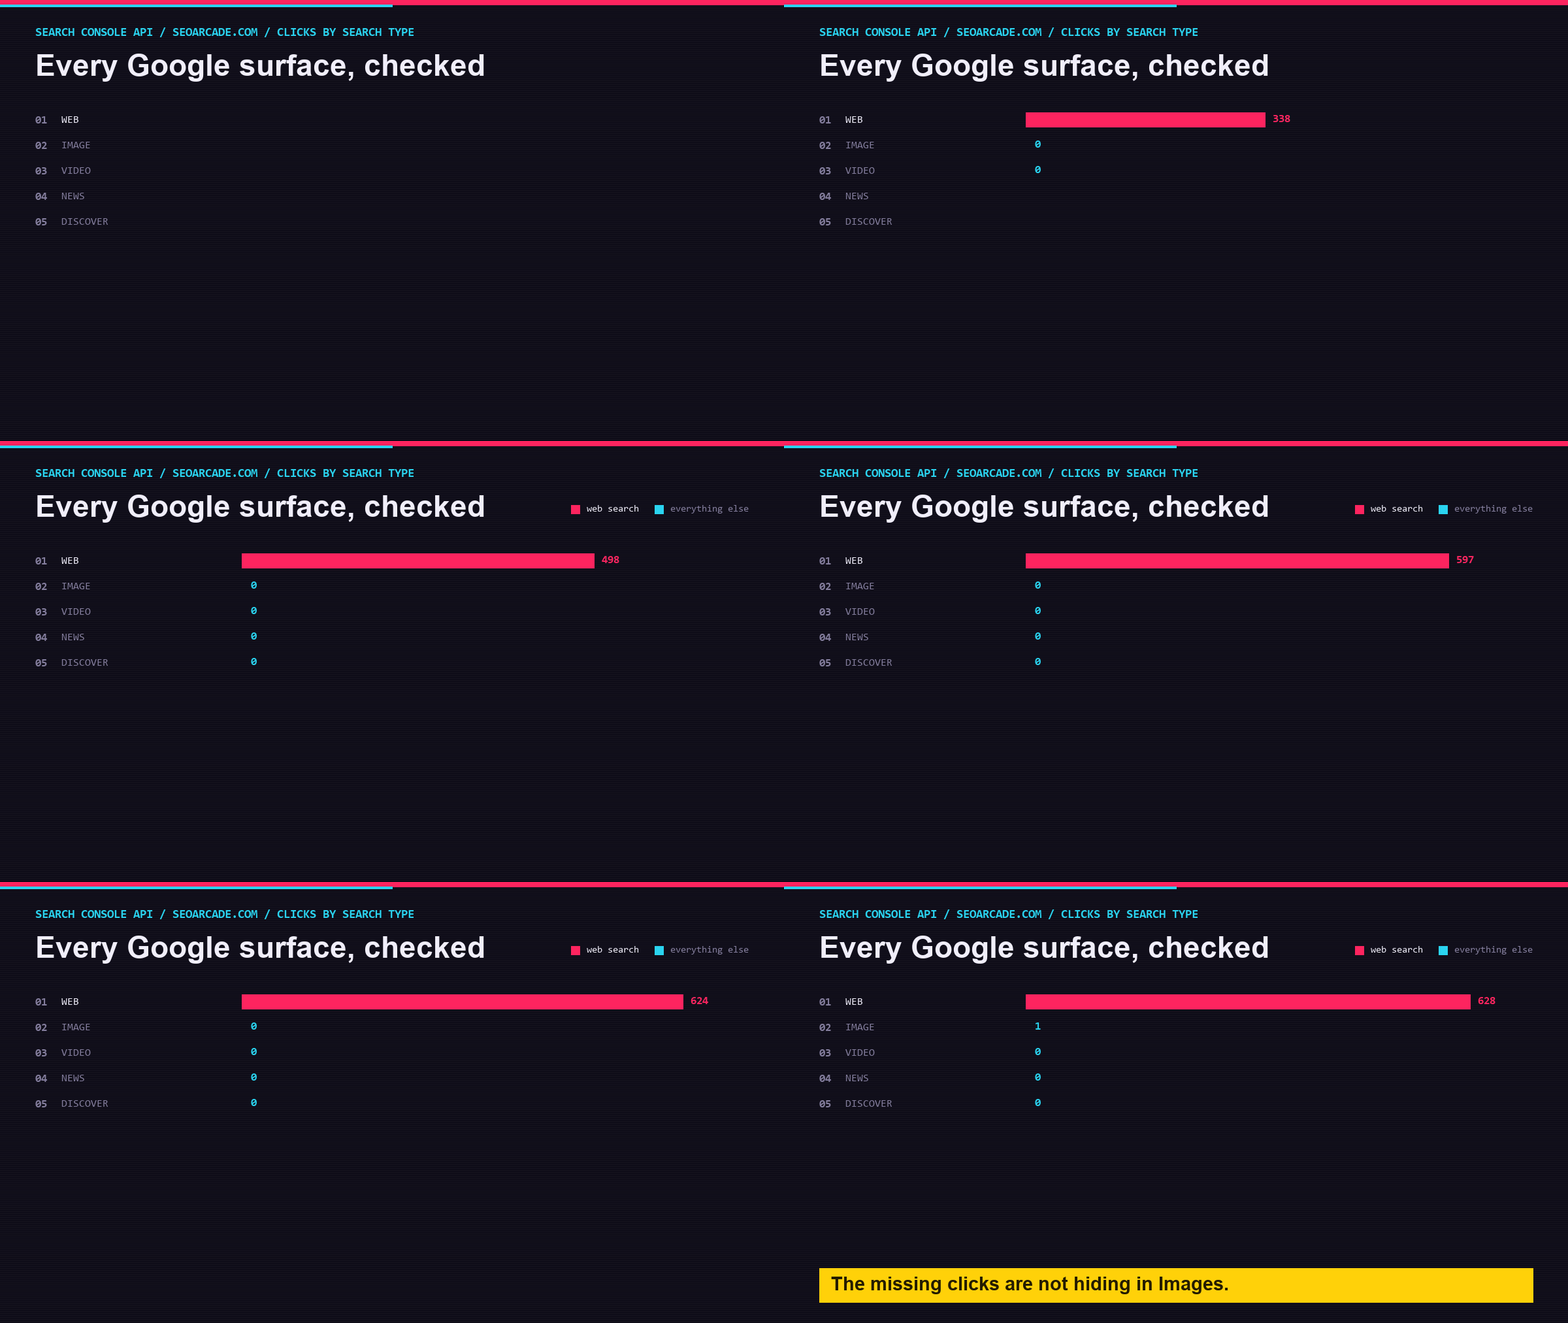
- The search-type filter. Search Console defaults to Web and your export inherits that filter. Pull all six types from the API instead. On my site: Web 628, Image 1, Video 0, News 0, Discover nothing. Your missing clicks are not hiding in Images, but you have to look before you can say that.
- Your property type. A URL-prefix property silently drops www and http variants. Check whether yours is a domain property. Mine is, so those were already counted.
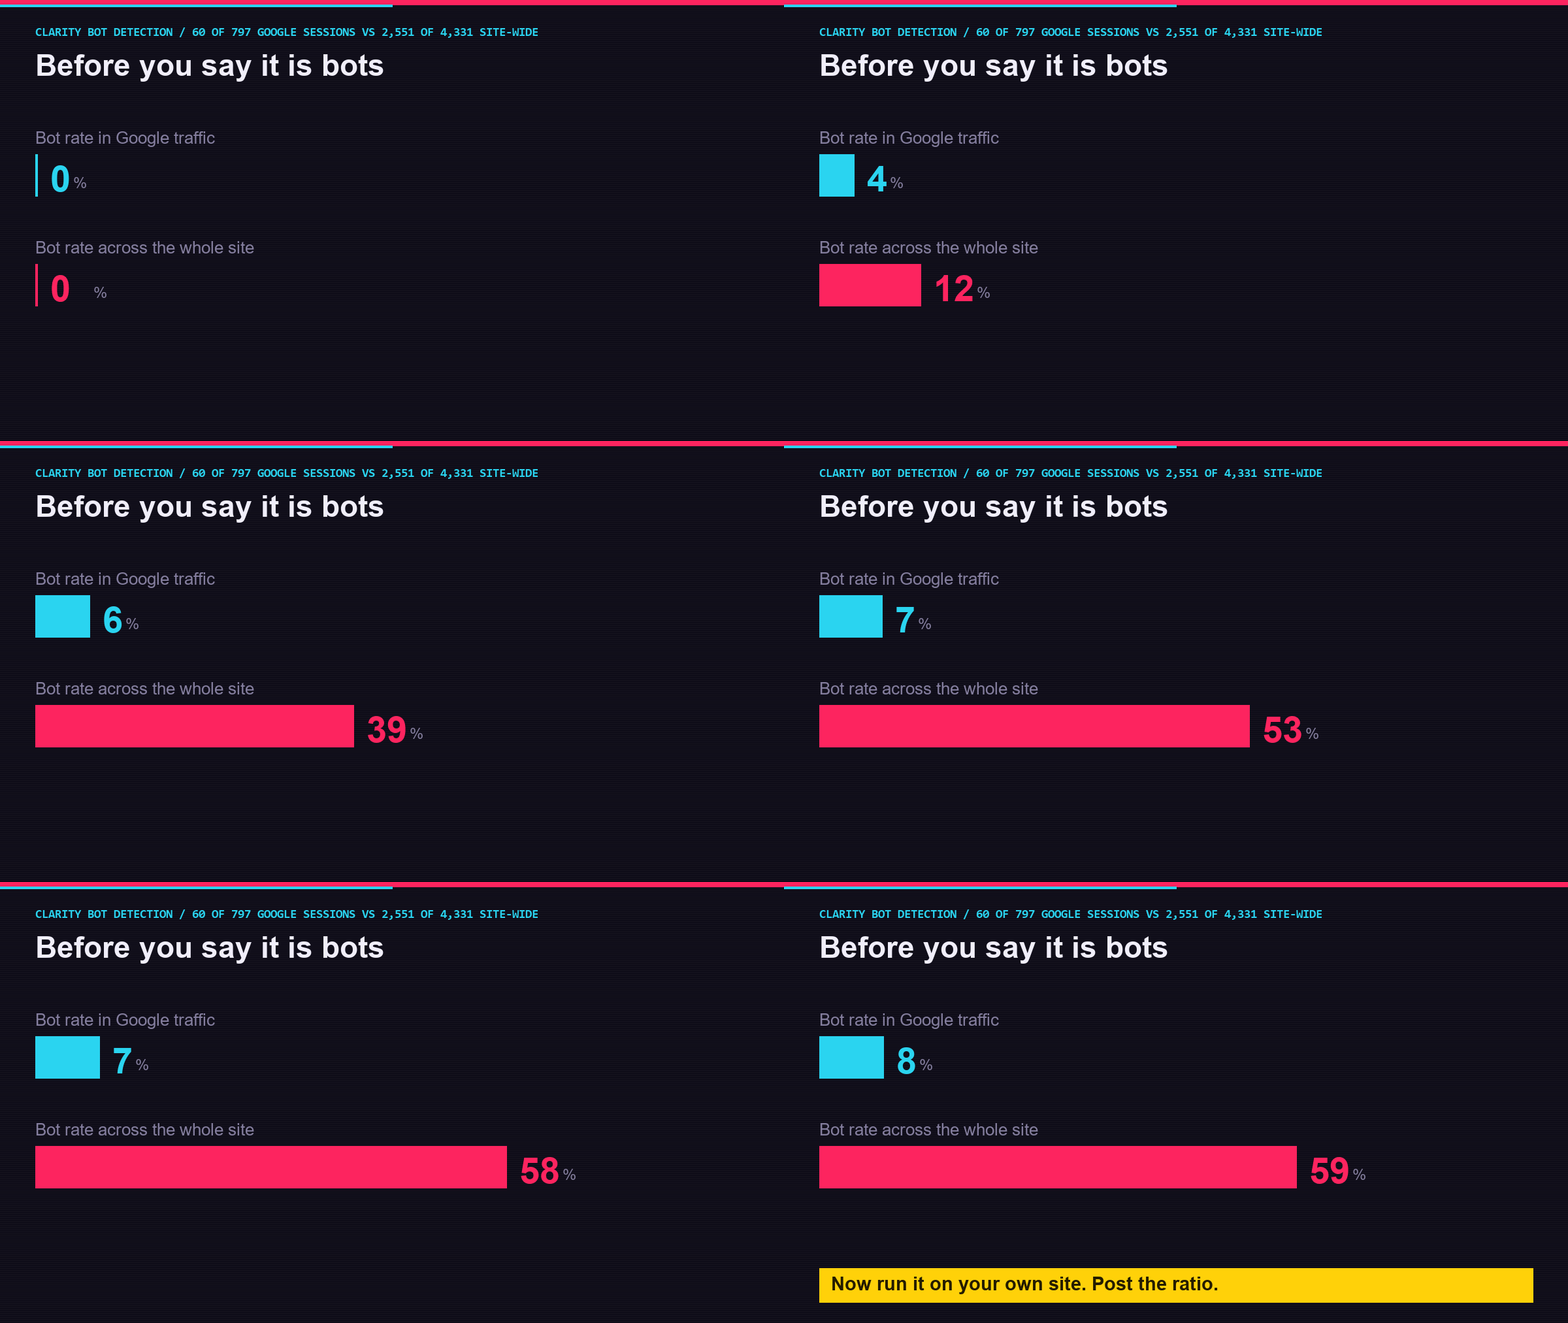
- Bots. This is the one you will reach for, and it is the one the data kills hardest. Clarity flagged 60 of 797 google-referred sessions as bots. That is 7.5%, against 2,551 across the whole site. Your automated traffic is not arriving through Google. It is sitting in Direct, where GA4 independently puts it too.
- Home page noise. If bots caused your gap, it would pile onto your home page. Remove the home page and recompute. Mine barely moved, and on deep pages carrying real volume it got wider.
One thing I could not rule out, and neither will you: Google surfaces that send traffic its own reporting never logs. In my GA4 data, search.google.com contributed 35 sessions that appear in no Search Console report at all. That is small. I think it is also proof the category exists.
Do not let GA4 be your referee
My first pass used GA4 and produced a 45% gap. I am glad I checked it, because it was wrong, and if you run this with GA4 you will get the same inflated answer.
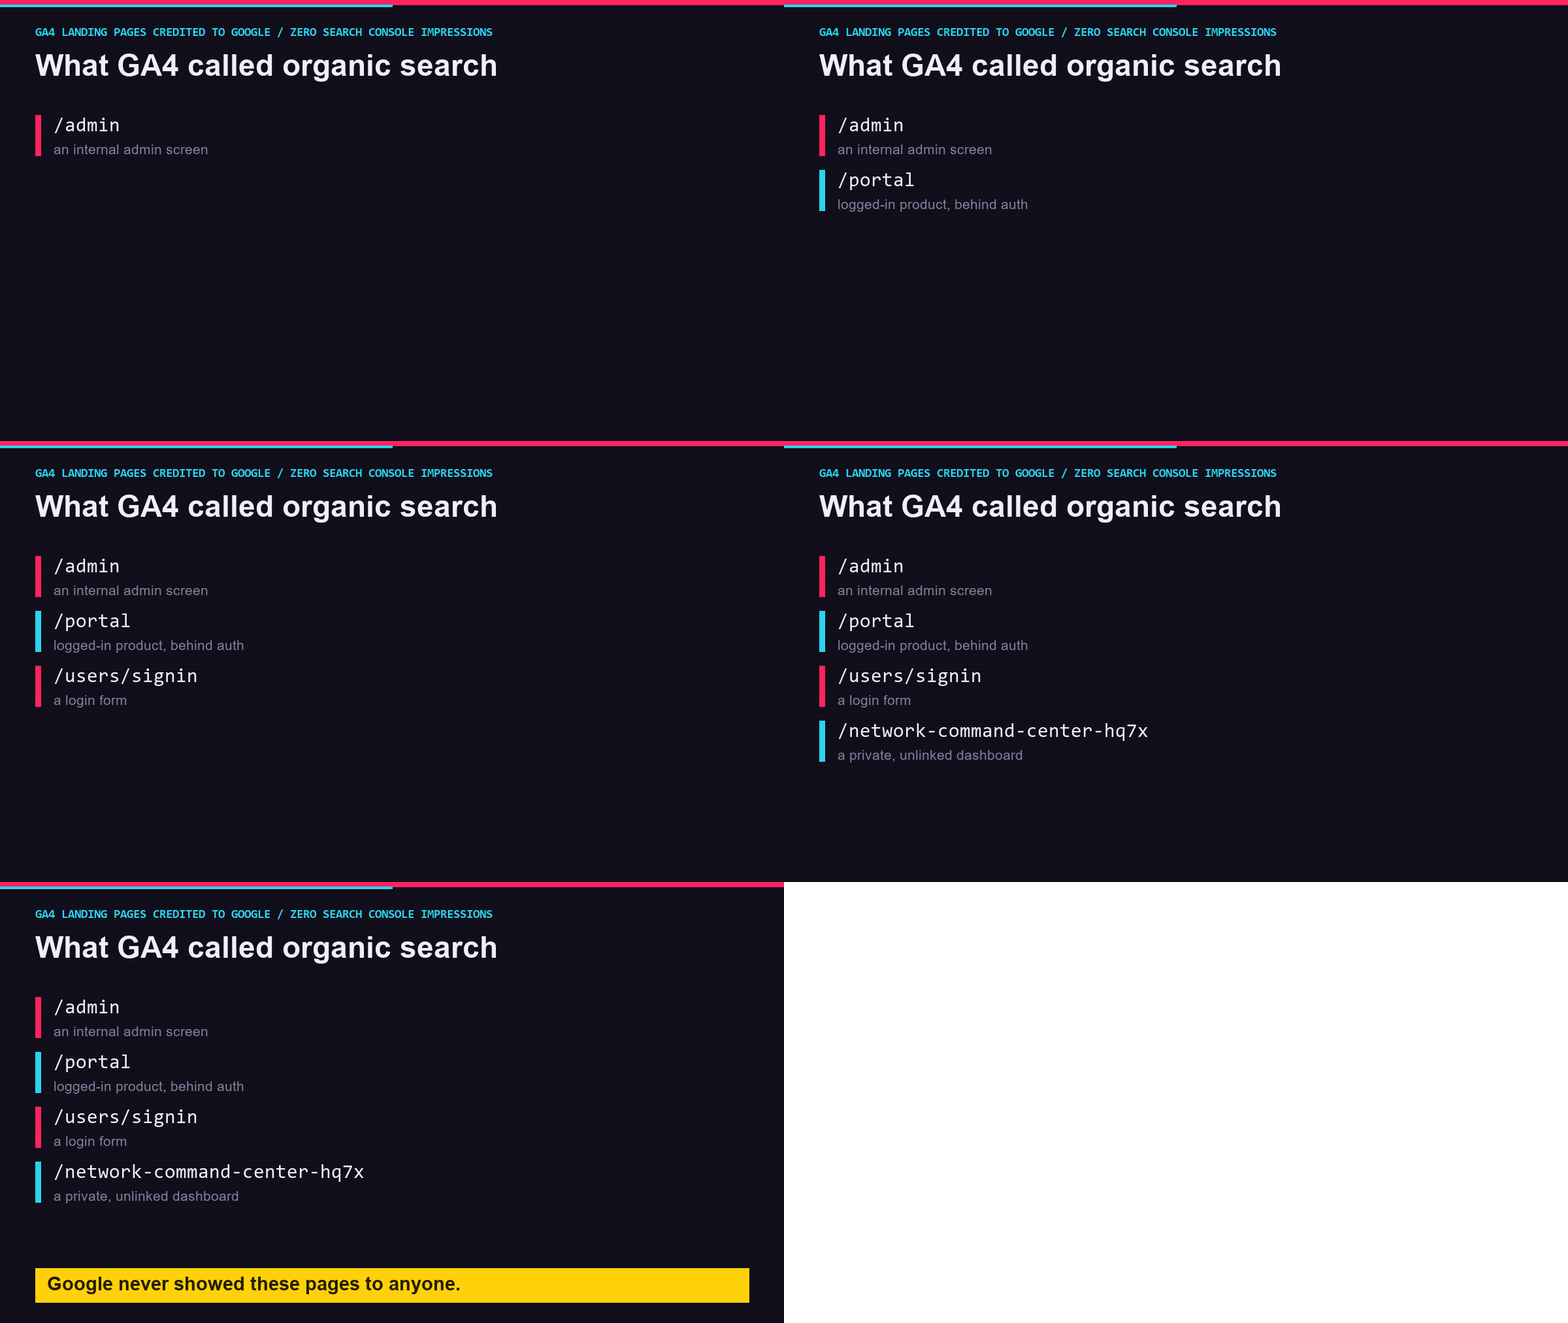
GA4 reads high for two reasons. Its bot filtering is weaker than Clarity’s. And session-scope attribution leaks badly: 20 of the 37 pages GA4 credited to google had zero Search Console impressions. Google has never shown /admin, /portal or /users/signin in a result, so those cannot be Google clicks. That is internal traffic wearing a google label, and you will have your own version of it.
Use GA4 to find your noise. Use something that is not Google, and that strips its own bots, to do your counting. Gert Mellak made the adjacent point when he called impressions almost useless, which pushed me to change eight things about how I report.
Run it on your own site
Four sites is a direction with a sample size, not a constant. That is why I am publishing my method instead of my conclusion.
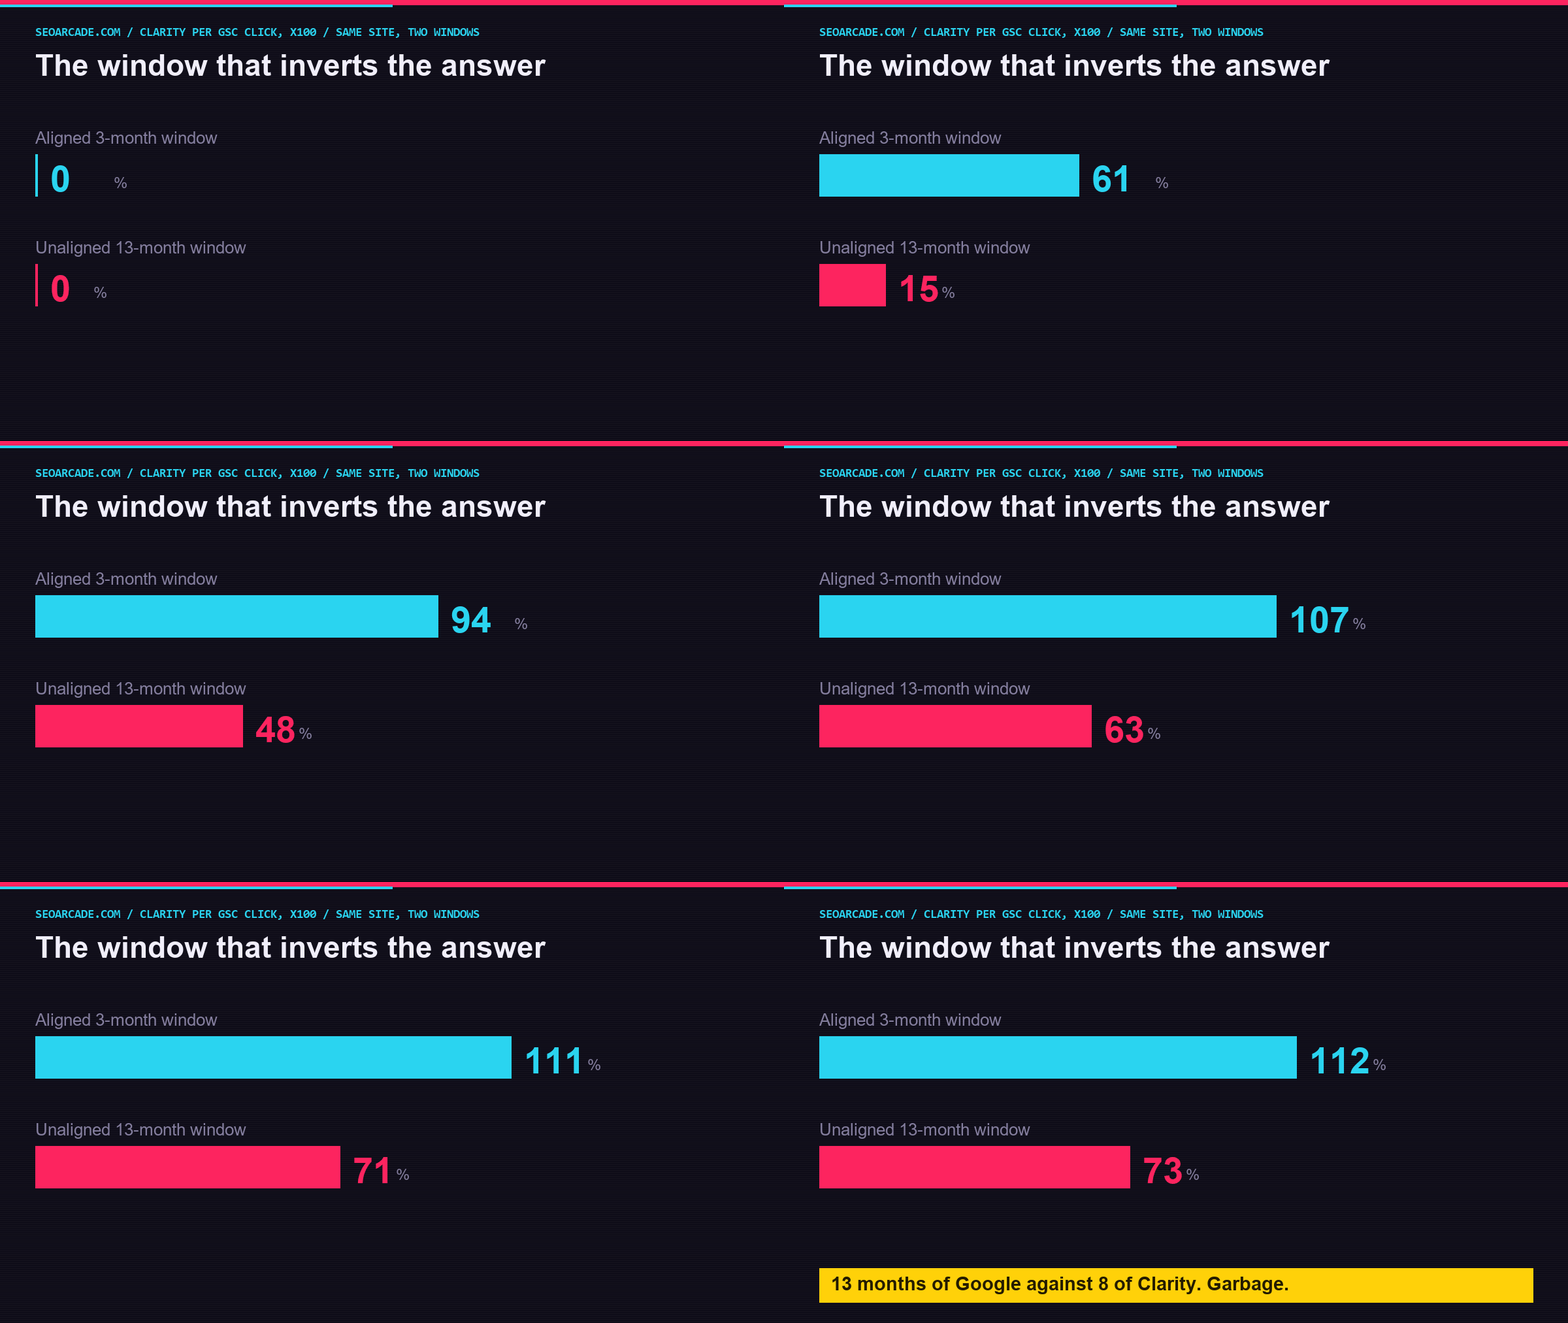
Before you start, my worst trap deserves saying twice: if your Clarity install is younger than your Search Console history, comparing full windows produces a ratio below 1.0 and inverts your answer completely. Align your windows or throw the number away.
If you have Search Console, GA4 and Clarity running on one site, you can check yours in about twenty minutes. Here are the seven prompts I used, in order. Paste each into an assistant that can reach your data, and swap in your own property, project and dates. Steps 2 and 3 are the ones that stop your result being an artefact, so do not skip them.
1. Baseline the real Search Console total
Not the number the interface shows you by default.
Using the Search Console API for MY-PROPERTY, return total clicks from START to END for every search type separately: web, image, video, news, discover, googleNews. Sum them and show the breakdown.

Do not filter to Web. The Search Console interface defaults to Web and any export inherits that filter, so the number most people quote is already short.

Also tell me whether the property is a domain property (sc-domain:) or a URL-prefix property. A URL-prefix property silently excludes www and http variants.
2. Find where your Clarity data actually starts
The single most common way to get a wrong answer.
In Microsoft Clarity for MY-PROJECT, find the earliest date that has session data. Do not assume it matches my Search Console history.

Two separate limits apply: the Clarity dashboard caps lookback at 396 days, and the tag may have been installed later than that. If Clarity covers less time than Search Console, every ratio computed across the difference is meaningless.
3. Set a window where both tools are complete
Misalignment can invert the result entirely.
Choose a window where BOTH tools have complete data.

Start = the later of (Clarity first data date, Search Console retention limit).
End = the last complete Search Console day, usually about two days ago.

Tell me the window you chose and why. Use that identical window for every query from here on.
4. Pull Clarity Google traffic with bots removed
Two traps in one step.
In the Clarity dashboard, set the Referring site filter to the full URL form https://www.google.com/ including protocol and trailing slash. A bare www.google.com returns zero results.

Then read the Sessions card and report two numbers: the session count, and the N bot sessions excluded line beneath it.

Important: the Clarity session total ALREADY excludes bots. The bot number sits on top of the total, it is not a subset of it. Getting this backwards reverses the conclusion.
5. Cross-check with GA4, but do not trust it
GA4 will overstate. Use it to locate noise, not to measure.
In GA4, pull landing page by session source for the same window, filtered to sessionDefaultChannelGroup = Organic Search. Isolate the rows where the source is google.

Expect GA4 to read HIGHER than Clarity. Its bot filtering is weaker, and session-scope attribution leaks internal pages in.

Then run the leakage check: how many of the GA4 google landing pages have ZERO Search Console impressions? Pages Google never showed cannot have received Google clicks. That count is the GA4 inflation, and it is usually admin, portal and login screens.
6. Compute the ratio, then try to break it
If it survives this, it is real.
Divide the Clarity bot-free Google sessions by the Search Console all-surface clicks for the aligned window. That is the headline ratio.

Now stress it. Recompute with the home page excluded. Automated and direct traffic concentrates on the home page, so if the ratio collapses without it you are looking at noise. If it holds or widens across the deeper pages, bots do not explain it.

Also report the median per-page ratio, not just the total.
7. Prove it is not dark clicks
The control that makes your result publishable.
Compare two things for the same window: the sum of clicks across all named queries, and the property-level click total.

The difference between those is the documented Search Console anonymisation, the well-known dark clicks. That is NOT what this test measures.

This test measures the gap between property-level clicks and a third-party count of real humans. It sits on top of the anonymisation gap. Report both numbers so the distinction is visible.
Report it back in this shape
So everyone else can compare their numbers to yours.
Site type (blog / ecom / local / SaaS):
Aligned window used:
Average position over that window:
Search Console clicks, ALL search types:
Clarity sessions, google.com referrer, bots excluded:
Bot sessions Clarity excluded:
Ratio (Clarity / GSC):
Ratio excluding the home page:
Median per-page ratio:
Query-level click sum vs property total (the dark-click gap, for contrast):
This is the same shape as the three prompts for pulling your actual CTR, and if you want to run them well rather than just paste them, OpenSEO’s guide to prompting Claude Code for SEO is the companion you want. It sits alongside everything else in the Search Console resource guide, and if you want the longer argument about where this tool helps and where it quietly misleads, work through the pros and cons list and Google Search Console data is not accurate.
So go run it. Post your ratio, your average position and your aligned window. If your page-one sites come back at parity and your page-three sites come back at 1.15x, then I am wrong about the cause and this is about ranking depth and AI surfaces – a far more interesting article than the one you just read. If your gap holds flat at every position, it is something else again and I have no idea what.
Either way, stop treating that click number as a count. It is an estimate, and it estimates low.